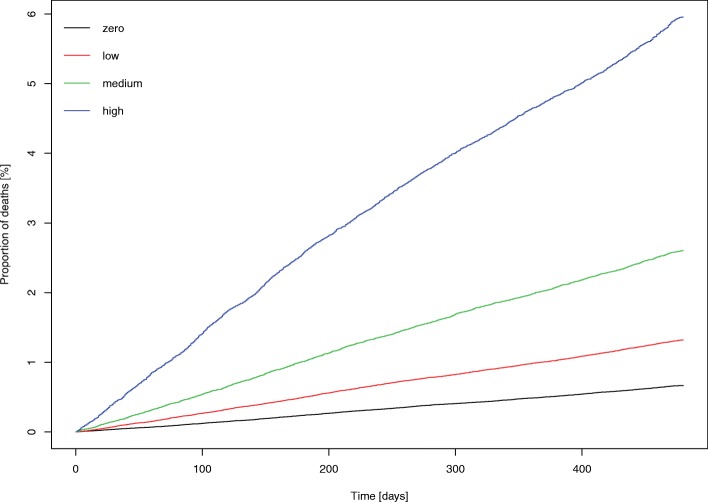
Fig. 2.
Cumulative incidence Kaplan–Meier plot showing proportions of deaths (all-cause mortality) over the follow-up period of 480 days. Graph shows zero, low, medium and high number of missed appointment groupings. Missed appointment categories were defined as the average annual number of missed appointments over a 3-year period, as follows: zero, 0; low, < 1; medium, 1–2; or high, > 2

