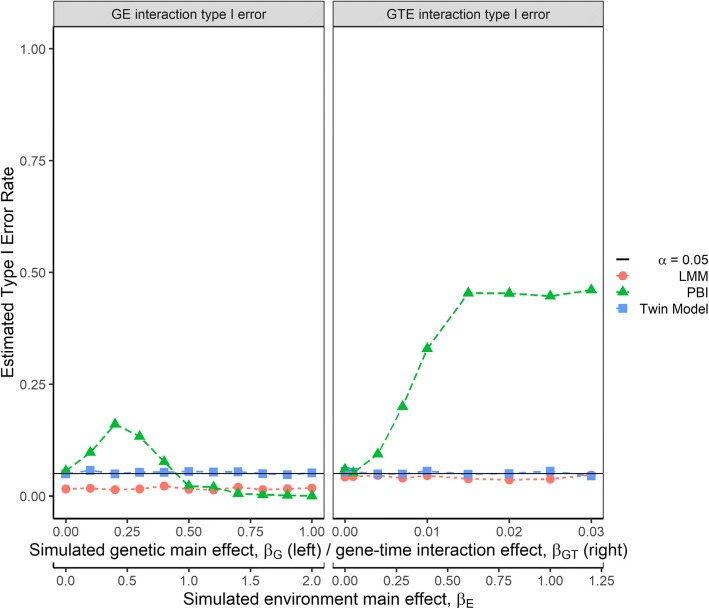
Fig. 4.
Estimated type I error rates for the compared analytical approaches. Type I error rates were estimated for each analytical approach as the proportion of false positive results (p-value < 0.05) calculated over 2000 simulation replicates with no interaction effect. Estimated type I error rates are shown for gene-environment (GE) interaction effect (left panel; simulation model includes a genetic main effect) and gene-time-environment (GTE) interaction effect (right panel; simulation model includes a gene-time interaction effect). The environmental main effect (βE) was included for all null scenarios

