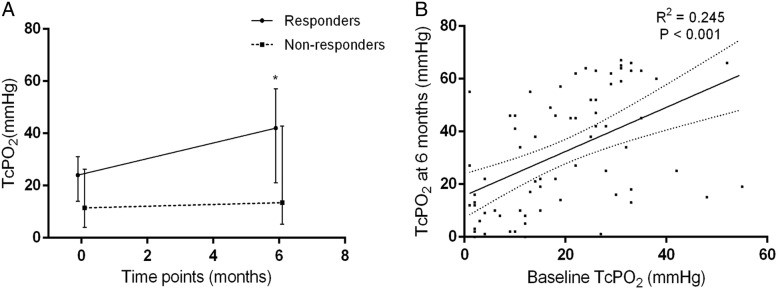
Fig. 2.
Comparison of longitudinal TcPO2 changes (median with interquartile range) in the ischemic limbs of the responders and non-responders (a) and linear regression between TcPO2 at baseline and at 6 months post-transplantation, depicted with a solid fitting line and dotted 95% confidential interval bars (b). *The difference between 6 months and baseline was statistically significant (P < 0.05). TcPO2, transcutaneous pressure of oxygen

