Fig. 2.

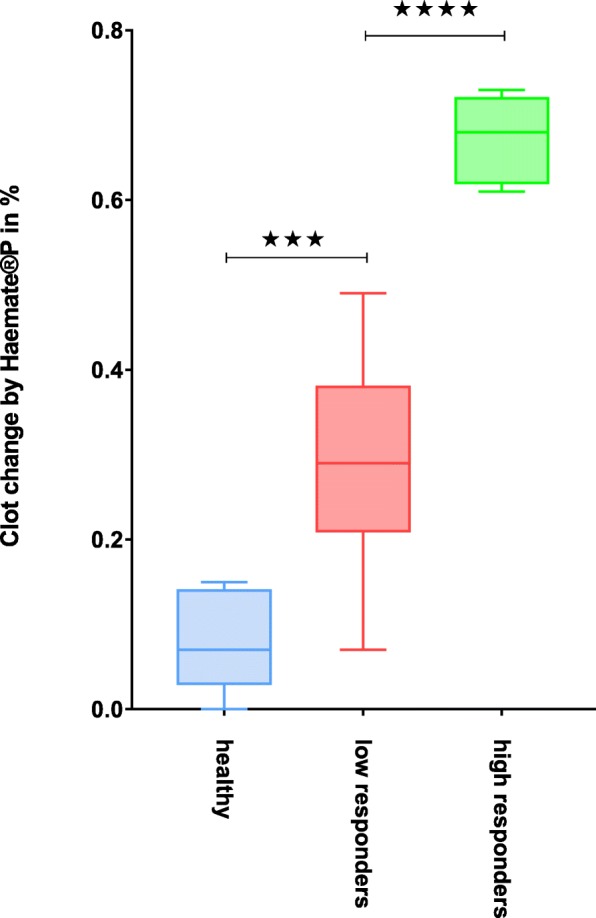
Statistical comparison of the response to Haemate® P in different groups. Legend: *** = p < 0.001, **** = p < 0.0001; Color code: Blue = healthy subjects, red = low responders, green = high responders

Statistical comparison of the response to Haemate® P in different groups. Legend: *** = p < 0.001, **** = p < 0.0001; Color code: Blue = healthy subjects, red = low responders, green = high responders