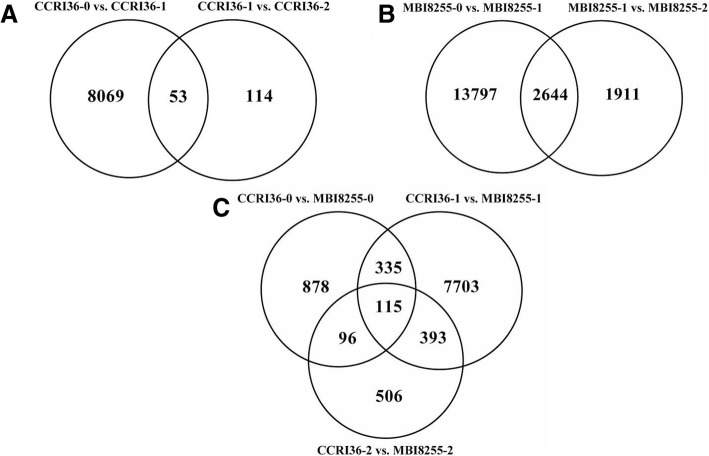
Fig. 6.
The differentially expressed genes from multiple comparisons between the different samples. a represents the comparisons of CCRI36 samples at the different stages, (b) represents the comparisons of MBI8255 samples at the different stages, (c) represents the comparisons of 2 lines at the same stages

