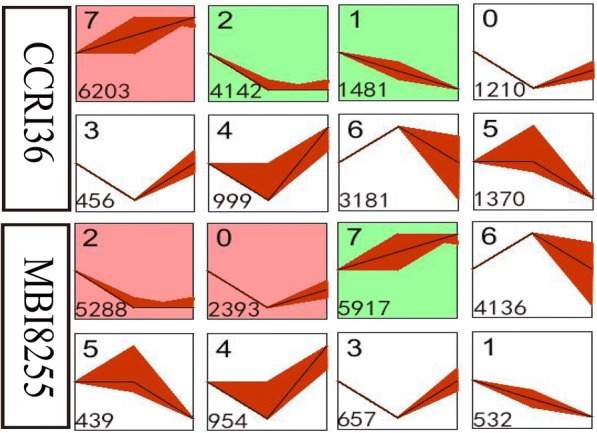
Fig. 7.

Different gene expression patterns by STEM software in two lines. Each square represents a trend of gene expression. The number in top left corner indicates the profile ID number, and the number in bottom left corner indicates the number of gens in that profile. The clusters and profiles were ordered based on the number of genes and significance (default), respectively
