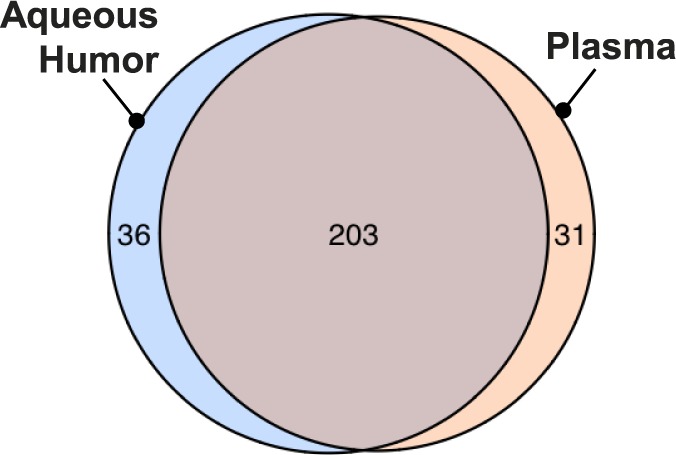
Figure 2.

A Venn diagram demonstrates the overlap between miRNAs identified in plasma and in aqueous humor (n = 56) across both cohorts. miRNAs were considered present when they appeared in at least 75% of samples from any one group (cataract or glaucoma/XFS from either cohort). These filtered data also represent the input dataset for 2-way ANOVA comparisons.
