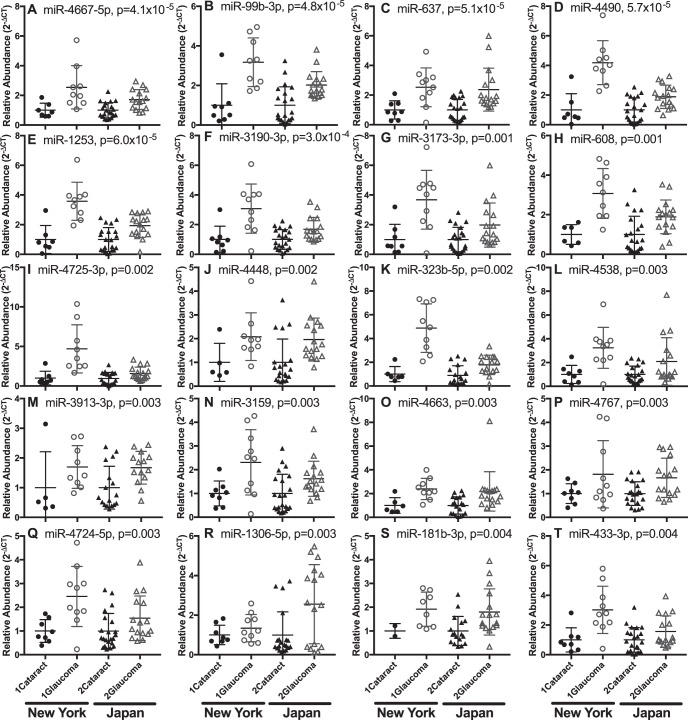
Figure 3.
Twenty plasma miRNAs (A–T, presented in descending order of significance) were elevated in glaucoma/XFS versus cataracts samples from both cohorts. Data are normalized to mean control abundance for each cohort. All differentially expressed miRNAs were identified by 2-way ANOVA (P values are presented). Fold changes for patient Cohort 1 and 2, along with false discovery rate corrected P values are listed in Table 3.

