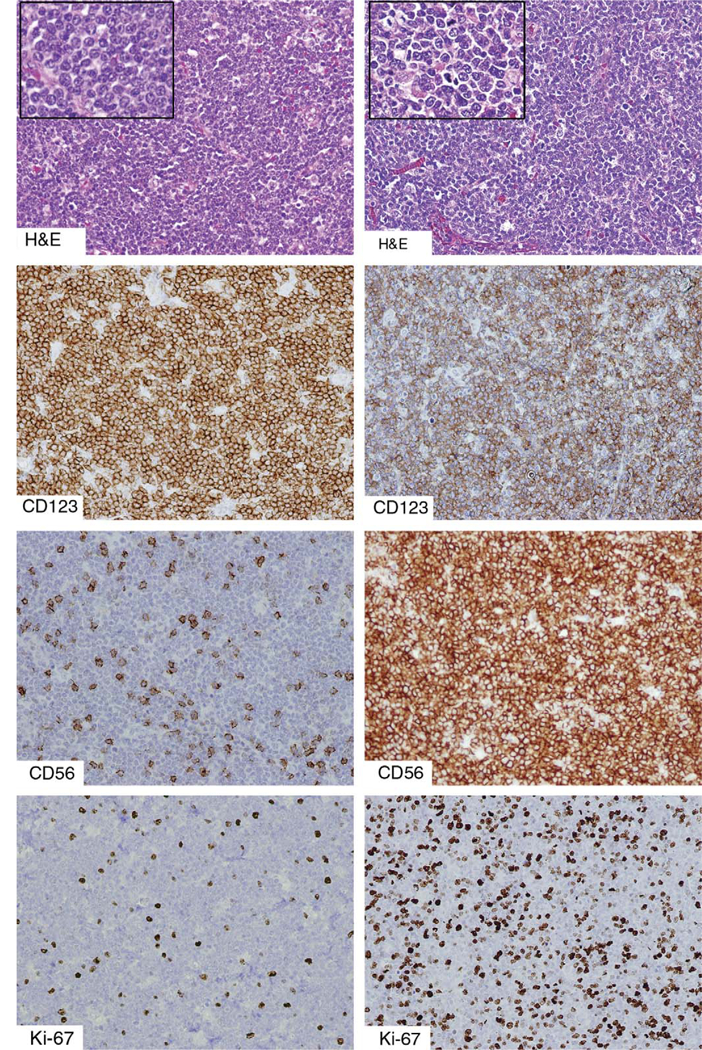
FIGURE 2.

An unusual example of a “tumor forming” PDC proliferation associated with a myeloid neoplasm, compared with BPDCN. The left column depicts a PDC proliferation in a patient with underlying chronic myelomonocytic leukemia, and the right column depicts a case of BPDCN, both diffusely effacing the underlying lymph node architecture. The distinction can be difficult on histologic examination alone, although the tumor forming PDCs are more round and uniform than the cells of BPDCN. Both are positive for CD123. Both CD56 and TdT (not shown) are usually negative in mature PDC proliferations, although a small subpopulation of PDCs may be CD56+, as shown. In contrast, BPDCN is more uniformly positive for CD56 and in almost half of all cases demonstrates TdT positivity. The Ki-67 proliferative index is typically very low (<10%) in mature PDC proliferations and higher (>30%) in BPDCN. BPDCN indicates blastic plasmacytoid dendritic cell neoplasm; PDC, plasmacytoid dendritic cells; TdT, terminal deoxynucleotidyl transferase.
