
Figure 4.
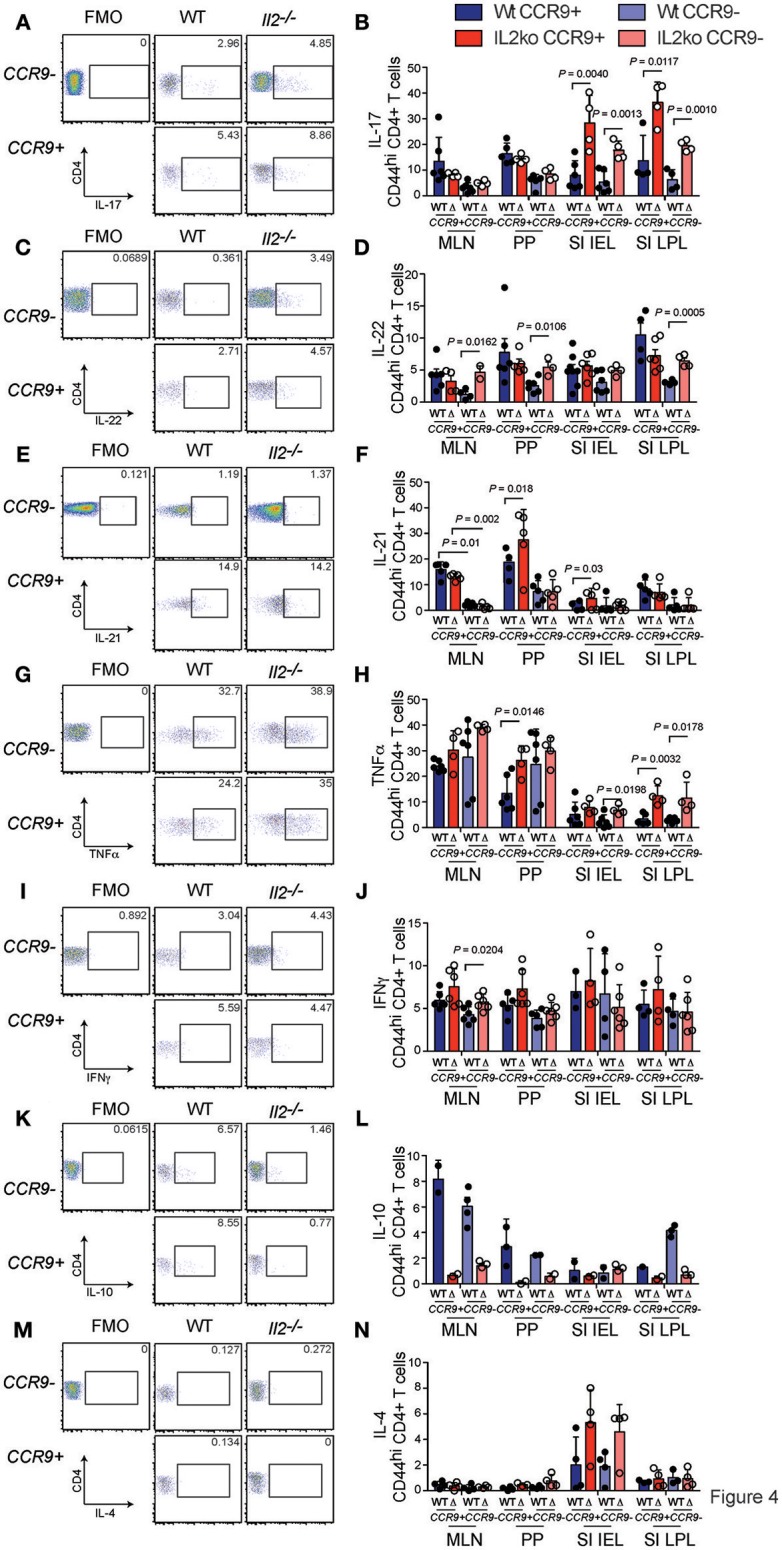
CCR9+ CD4+ Th cells exhibit a distinct cytokine profile in the inflamed GIT. Detection of cytokines in CCR9+ and CCR9− Th cells from GIT associated lymphoid tissues of Il2−/− and WT mice by intracellular immunostaining and FACS analyses. (A) Representative FACS dot plot and (B) quantitation of IL-17. (C) Representative FACS dot plot and (D) quantitation of IL-22. (E) Representative FACS dot plot and (F) quantitation of IL-21. (G) Representative FACS dot plot and (H) quantitation of TNFα. (I) Representative FACS dot plot and (J) quantitation of IFNγ. (K) Representative FACS dot plot and quantitation (L) of IL-10. (M) Representative FACS dot plot and (N) quantitation of IL-4. MLN, mesenteric lymph nodes; PP, Peyer's Patches; SI IEL, intraepithelial lymphocytes of the small intestine; SI LPL, lamina propria lymphocytes of the small intestine; LI IEL, intraepithelial lymphocytes of the large intestine; LI LPL, lamina propria lymphocytes of the large intestine. Data are shown as mean ± SD, where n = 3–6 female mice of 7–9 weeks of age. Statistical significance was analyzed by students T-test.