Figure 8.
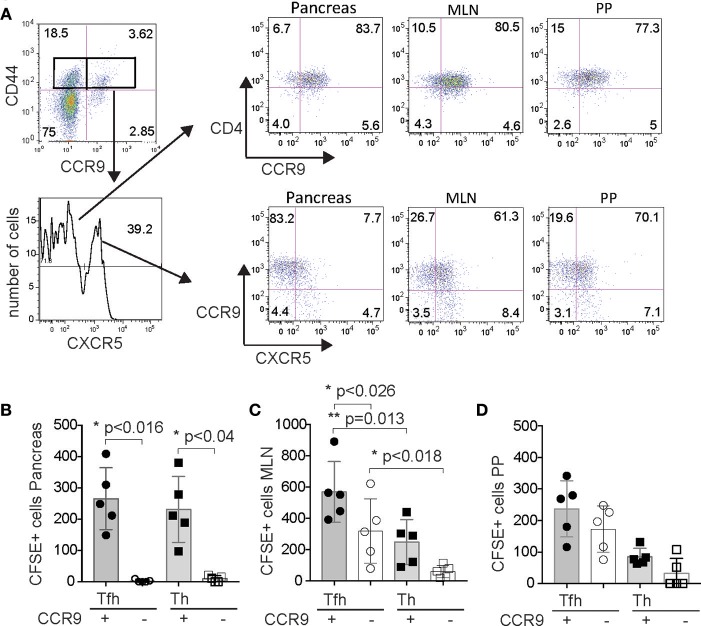
CCR9 marks GIT-derived Tfh cells and Th cells that migrate to the pancreas. (A) FACS sorting strategy showing representative FACS dot plots gated on CD4 and then CD44 vs. CCR9 and FACS histogram of CXCR5 expression for purification of CCR9+ CXCR5+ Tfh cells, CCR9− CXCR5+ Tfh cells, CCR9+ CXCR5− Th cells and CCR9− CXCR5− Th cells from the PP and MLN, and representative FACS dot plots of CCR9+/− Th cells and CCR9+/− Tfh cells from the pancreas infiltrate, mesenteric lymph nodes (MLN) and Peyers patches (PP). 6 × 10⁵ CFSE labeled cells from each of the 4 subsets were injected (i.v.) into age matched female NOD recipients (n = 5/transfer group). Quantitation showing numbers of CFSE labeled CD4+ CCR9+ and CD4+ CCR9− Tfh and Th cells recovered from the (B) pancreas, (C) mesenteric lymph nodes and (D) Peyers patches of NOD mice 4 days after adoptive transfer. Statistical significance was assessed by 2-way ANOVA using Bonferroni's multiple comparisons test.

