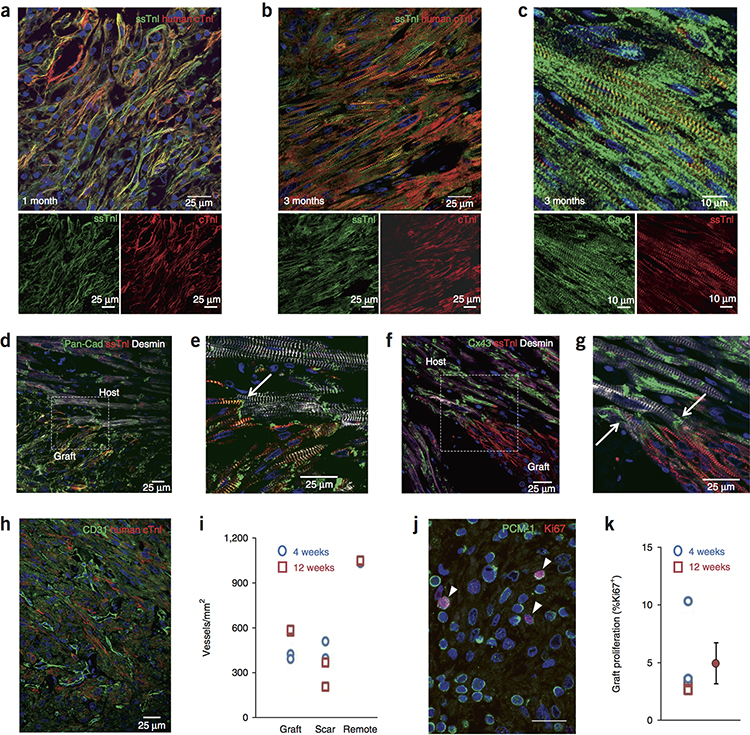
Figure 4. Graft maturation, integration, vascularization and proliferation.
(a, b) hESC-CM grafts stained for slow skeletal troponin I (ssTnI, green) and human cardiac troponin I (cTnI, red). Merged image on top, individual channels below. Scale bar, 25 μm. (a) At 1 month the hESC-CMs are relatively small, have peripheral myofibrils and exhibit low cellular alignment. Low level expression of cTnI is evident. This experiment was repeated in 2 biologically independent hESC-CM treated hearts with similar results. (b) At 3 months the cells have hypertrophied, have myofibrils throughout the cytoplasm and are better aligned. Increased expression of cTnI is evident. This experiment was repeated in 2 biologically independent hESC-CM treated hearts with similar results. (c) At 3 months, graft T-tubule networks are present, shown by caveolin-3 staining (Cav3, green). ssTnI, red. This experiment was repeated in 2 biologically independent hESC-CM treated hearts with similar results. Scale bar, 10 μm. (d) Interface of 3-month graft and host myocardium stained for pan-cadherin (green), ssTnI (human graft, red) and desmin (graft + host, white). This experiment was repeated in 2 biologically independent hESC-CM treated hearts with similar results. Scale bar, 25 μm. (e) Magnified image of region boxed in (d) demonstrates cadherin-positive adherens junction at intercalated disk between graft and host (arrow). This experiment was repeated in 2 biologically independent hESC-CM treated hearts with similar results. Scale bar, 25 μm. (f) Interface of 3-month graft and host myocardium stained for connexin43 (Cx43, green), ssTnI (human graft, red) and desmin (graft + host, white). This experiment was repeated in 2 biologically independent hESC-CM treated hearts with similar results. Scale bar, 25 μm. (g) Magnified image of region boxed in (f) demonstrates connexin43-positive gap junctions at intercalated disks between graft and host (arrows). This experiment was repeated in 2 biologically independent hESC-CM treated hearts with similar results. Scale bar, 25 μm. (h) Vascularization of the human myocardium (human cTnI-positive, red) by host microvessels is demonstrated by staining endothelial cells for CD31 (green). This experiment was repeated in 4 biologically independent hESC-CM treated hearts with similar results. Scale bar, 25 μm. (i) Quantitation of vascular density in graft, scar and remote myocardium at 4 and 12 weeks. Each point is 1 heart. Data are from 4 biologically independent control animals and 4 hESC-CM treated animals. (j) Proliferation of 4-week hESC-CM graft demonstrated by staining for pericentriolar material-1 (PCM-1; green) and Ki67 (red). Cardiomyocyte nuclei in cell cycle are indicated by arrowheads. This experiment was repeated in 4 biologically independent hESC-CM treated hearts with similar results. Scale bar, 20 μm. (k) Quantitation of graft cardiomyocyte proliferation at 4 weeks and 12 weeks. Each point is 1 heart. Data are from 2 biologically independent hESC-CM treated hearts each at 2 and 4 weeks. Group data are mean ± SEM for all 4 hearts.

