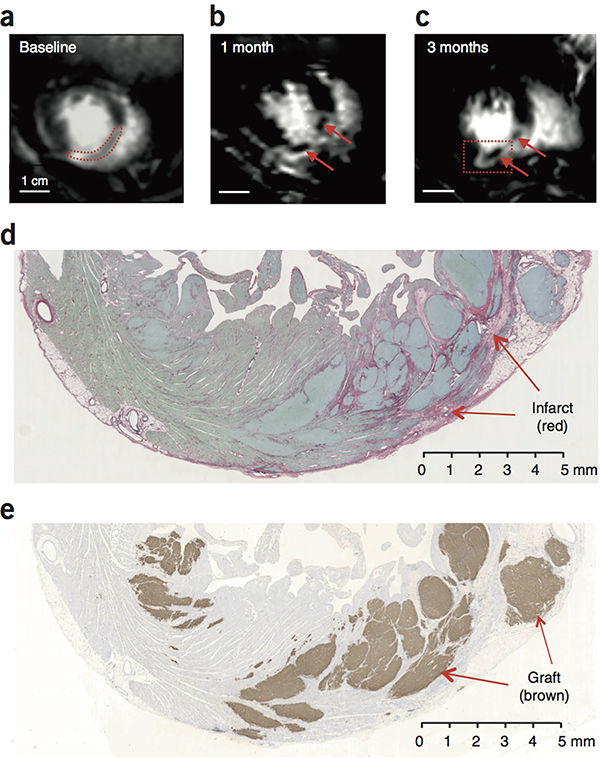
Figure 5.
Visualization of grafts by MRI. (a–c) Delayed Gd enhanced MR images of macaque heart to identify the infarct scar. Blood in the chambers appears bright. Viable myocardium appears dark, and infarcted tissue appears light gray. The same short-axis region of the heart is shown in each scan. (a) At baseline, the infarct is a homogeneous tissue located in the anterior wall and interventricular septum (outlined by red dotted line). (b, c) At 1 month and 3 months post-engraftment, new areas of viable dark (Gd-negative) tissue appear within the infarct (arrows). (d) Histological section corresponding to the region boxed in (c) stained with picrosirius red to identify collagen and fast green to identify myocardium. Infarct scar is readily identifiable as red tissue, but it contains islands of green tissue consistent with myocardium. Scale bar, 5 mm. (e) Adjacent section from region boxed in (c) stained for human cTnT (brown) to identify human myocardial graft. There is extensive human myocardium within the infarct and in the lateral border zone, measuring >1 cm in maximal dimension. Note that human myocardium within the scar would be visible by MRI, but grafts in the border zone host myocardium would be MRI-invisible, since both exclude Gd. This experiment was repeated 4 times with biologically independent hESC-CM treated animals, with similar results found in 3. In 1 animal, the graft could not reliably be distinguished by MRI.

