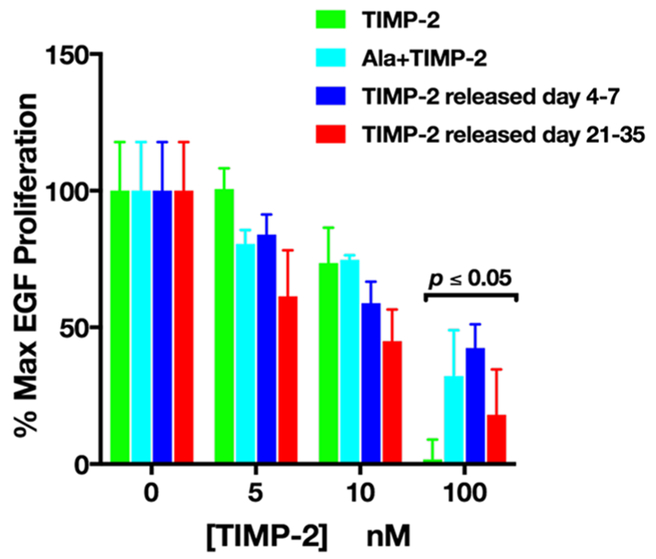
Figure 5.
Dose dependent inhibition of rhEGF-mediated A549 cell proliferation. Cell proliferation was quantified by determining cell numbers 72 h following rhEGF treatment with and without TIMP-2 pretreatment and normalized to basal cell numbers using a MTT assay (as described). Absorbance values were converted to % max EGF proliferation (mean ± SEM, n = 3). Statistical analysis (t test; comparison of 0 nM vs 100 nM for all conditions; n = 3; p ≤ 0.05) was performed using Prism software (v 7.0).

