
. 2019 Jan 9;21(1):e10421. doi: 10.2196/10421
©Hannah Long, Yvonne K Bartlett, Andrew J Farmer, David P French. Originally published in the Journal of Medical Internet Research (http://www.jmir.org), 09.01.2019.
This is an open-access article distributed under the terms of the Creative Commons Attribution License (https://creativecommons.org/licenses/by/4.0/), which permits unrestricted use, distribution, and reproduction in any medium, provided the original work, first published in the Journal of Medical Internet Research, is properly cited. The complete bibliographic information, a link to the original publication on http://www.jmir.org/, as well as this copyright and license information must be included.
Figure 1.
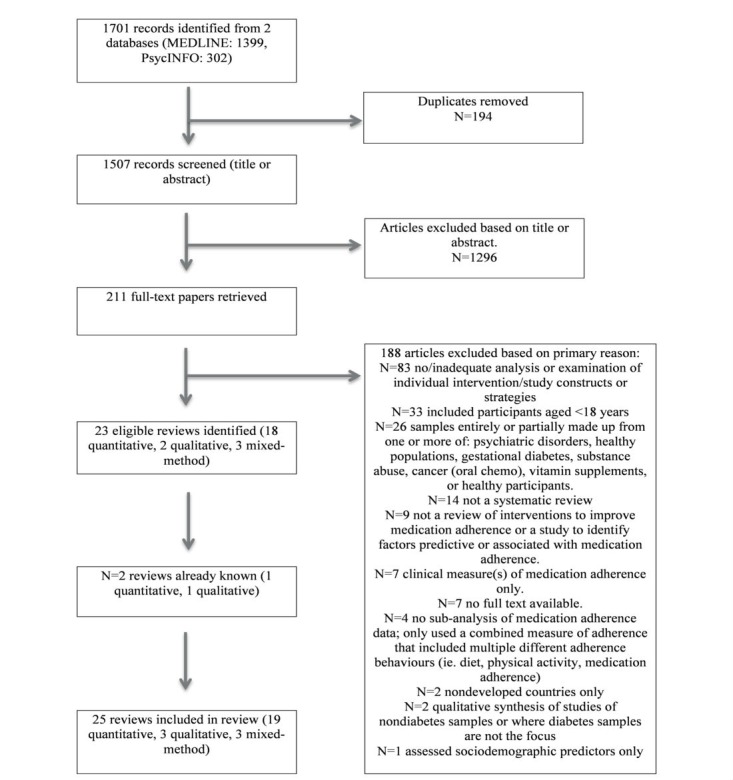
Flow diagram of study inclusion and exclusion process.