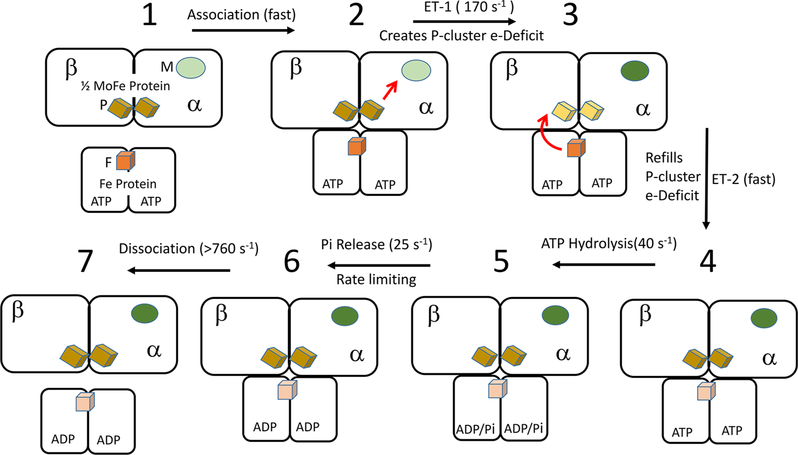
Figure 3.
Updated Fe protein cycle. Shown is the Fe protein with two bound nucleotides and half of the MoFe protein with the P-cluster (P) and the FeMo cofactor (M). The cycle starts at the top left and proceeds clockwise, with the relevant transitions between states and reported rate constants noted on the black arrows. Electron transfers are noted with red arrows. The metal clusters and oxidation states are noted in Figure 1.

