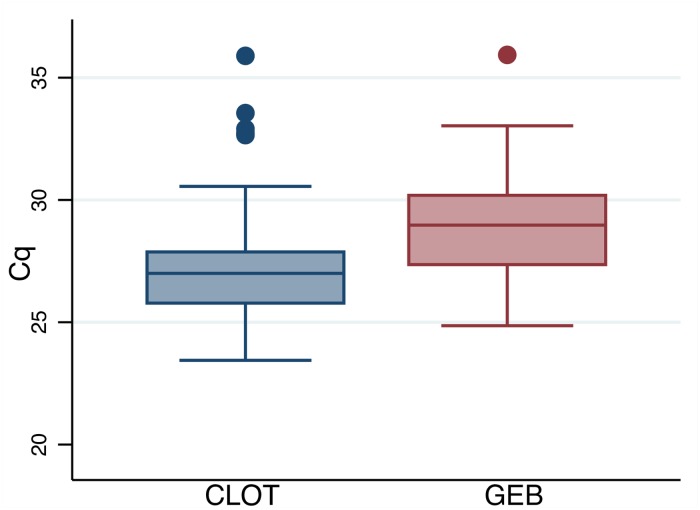
Fig 1. Distribution of Cq values in GEB and clot samples.
The line inside the box represents the median, and the box comprises the lower and upper quartiles. The mean Cq for clot samples (extracted using the new technique) was 27.32 [95%CI: 26.69–27.95]. The mean Cq for GEB samples was 29.02 [95% CI: 28.36–29.67] (P = 0003). Agreement between the two samples was 95.9% (Kappa = 0.8483). Out of the five samples that tested positive in the clot extracted DNA with a Cq value greater than 32, three were also positive on the qPCR using DNA from GEB samples.

