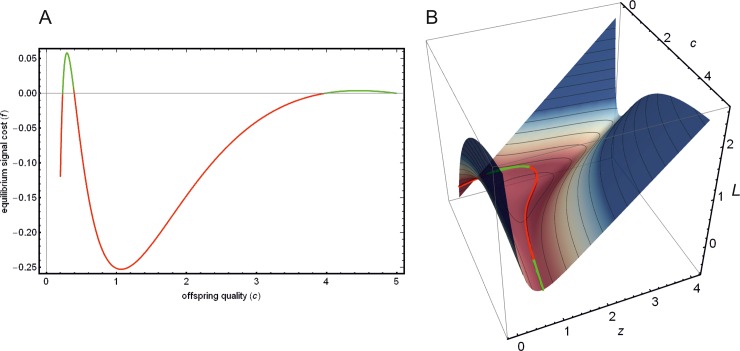
Fig 5. Negative equilibrium cost.
(B) Cost of signalling L depending on offspring condition c and amount of transferred resource z (Eq 18). Red-green curve along the surface (and in inset) indicates equilibrium cost function (f(x*(c))) at equilibrium (Eq 19), where red sections indicate negative cost values. (A) shows this curve projected to the c-f(c) plane. Parameters are: .

