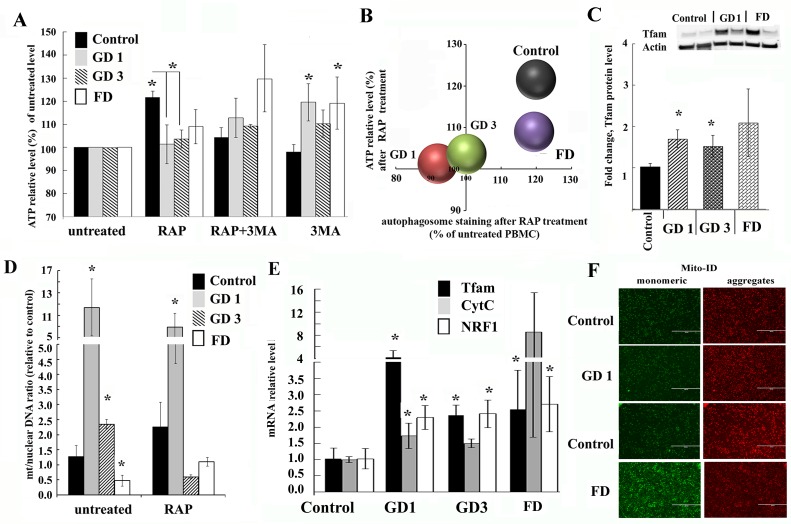
Fig 3. Mitochondrial function is affected in GD and FD.
(A) Effect of rapamycin (RAP) treatment on ATP levels. PBMCs from healthy subjects, GD and FD were treated for 3h with the 10 nM RAP alone, 20 μM 3MA or a combination. ATP levels were measured using CellTiter-Glo assay. Samples were measured in triplicates, control group n = 4, GD1 n = 6, GD3 n = 3, FD n = 4. All data were expressed as S.E.M. and * p<0.05 vs untreated control. (B) A scatter diagram comparing autophagosome volume to ATP levels in response to 10 nM RAP treatment for 3h. (C) Quantification of Tfam protein level from control (n = 10), GD1 (n = 10), GD3 (n = 3) and FD (n = 6) samples after detection by western blotting. Quantification of relative level of Tfam normalized to actin. Insert: representative western blot showing Tfam protein expression in healthy subjects (control), GD1 and FD samples. *p<0.05 control vs GD (Student’s T test, One-way ANOVA with Kruskal-Wallis test) and p = 0.037 controls vs. GD (Dunn’s multiple comparisons test). (D) Analysis of mitochondrial biogenesis. PBMCs from healthy subjects (Control), GD1, GD3 and FD were treated with the 10 nM rapamycin for 3h. The data is the ratio of the mitochondrial encoded gene ND1 to nuclear-encoded GAPDH as determined by qPCR. Untreated PBMCs from healthy subjects served as the control and an average of their values was set as 1. Data were expressed as S.E.M. and * p<0.05 (E) Q-PCR was performed to determine relative Tfam, CytC and NRF1 mRNA expression levels in GD1 and FD samples. RNA level was measured in triplicates, n = 3–4 samples analysed each group. All data were expressed as S.E.M. and * p<0.05 vs control group. (F). Fluorescence images of ΔѰm. The mitochondria of freshly isolated PBMCs from patients with GD, FD and healthy controls were stained with Mito-ID Membrane Potential reagent, and visualized by fluorescence microscopy. Green fluorescence color stain mitochondria with a low membrane potential, highly polarized mitochondria exhibit red color.

