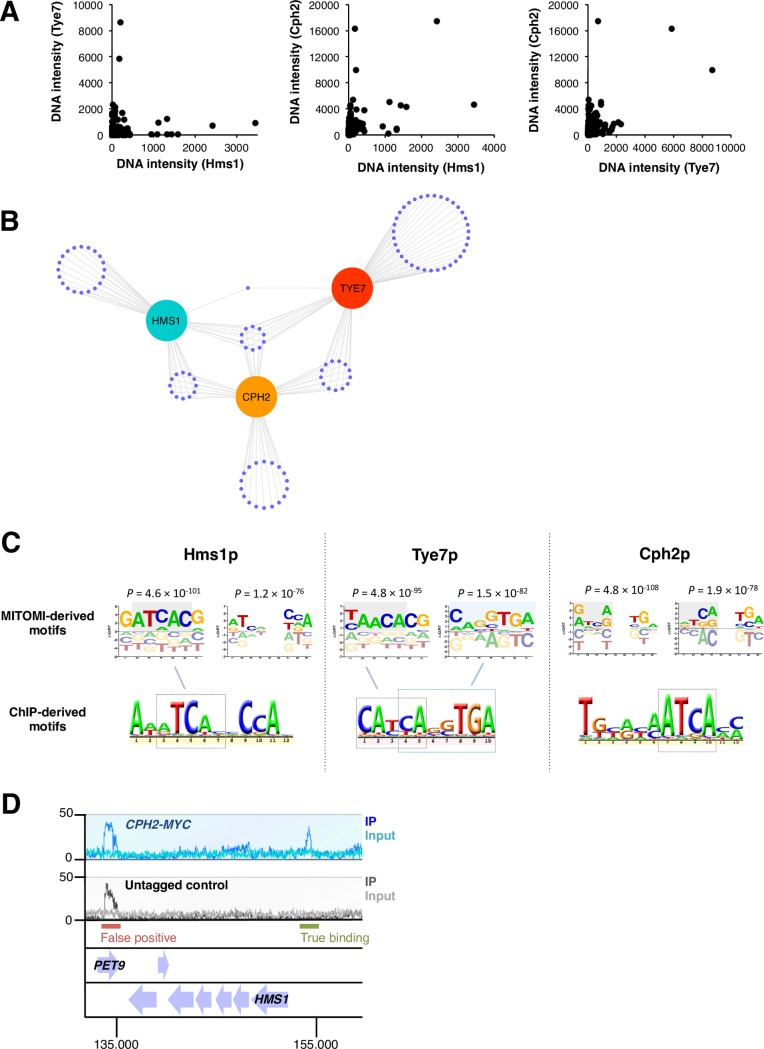
Fig 2. The three branches of ascomycete yeasts’ SREBPs differ from one another in their DNA binding specificities.
(A) In vitro DNA binding preferences of the C. albicans SREBPs Hms1p, Cph2p and Tye7p in MITOMI, a microfluidics-based approach. Each transcription regulator was evaluated for binding to a set of 740 double-stranded 70-nt oligos designed so that all possible 8-mers were represented. Binding was quantified by measuring the ratio of fluorescence emitted from labeled DNA bound to surface-immobilized labeled regulators. The intensity of binding (DNA intensity) to each oligonucleotide is plotted for each of the three proteins (one dot represents one oligonucleotide). Shown are pairwise comparisons among the regulators. Notice the orthogonal relationship among pairs, particularly between Tye7p and Hms1p. The MITOMI data was derived from two biological replicates. (B) Distribution of top 10% of oligonucleotides bound by the C. albicans SREBPs Hms1p, Cph2p and Tye7p in MITOMI. Each purple dot represents one oligonucleotide. The distances separating the three proteins (cyan, orange and red circles) are inversely proportional to the number of shared oligonucleotides. (C) DNA motifs preferred by the C. albicans SREBPs Hms1p, Cph2p and Tye7p. Shown are representative motifs derived from MITOMI (top) and ChIP (bottom) data sets. Full list of MITOMI motifs with scores (r2 and P-values) are included in S2 Table. Highlighted is the likely correspondence between MITOMI and ChIP motifs. Notice that the Hms1p MITOMI motif that includes a 2-nucleotide spacer is a very close match to the full Hms1p ChIP motif. The Cph2p MITOMI motifs imply that, in vitro, this protein may recognize both ATCANNTGA and ATCANNCCA sequences whereas the ChIP motif suggests binding to the left half-site only (ATCA). The ChIP-derived motif for Cph2p was derived from data included in this report. The ChIP motifs for Tye7 and Hms1p were derived from references [27] and [29], respectively. (D) ChIP-Seq analysis of C. albicans Cph2p. Chromatin immunoprecipitation was carried out with a strain expressing a constitutively active MYC-tagged Cph2p (blue track) and an untagged control strain (grey track). Shown is a 25 kb region of chromosome 5 where a binding event (upstream of the HMS1 gene) can be visualized and distinguished from a false positive (in the PET9 gene). 14 binding regions were consistent across replicates and therefore used for the DNA motif analysis displayed in C.

