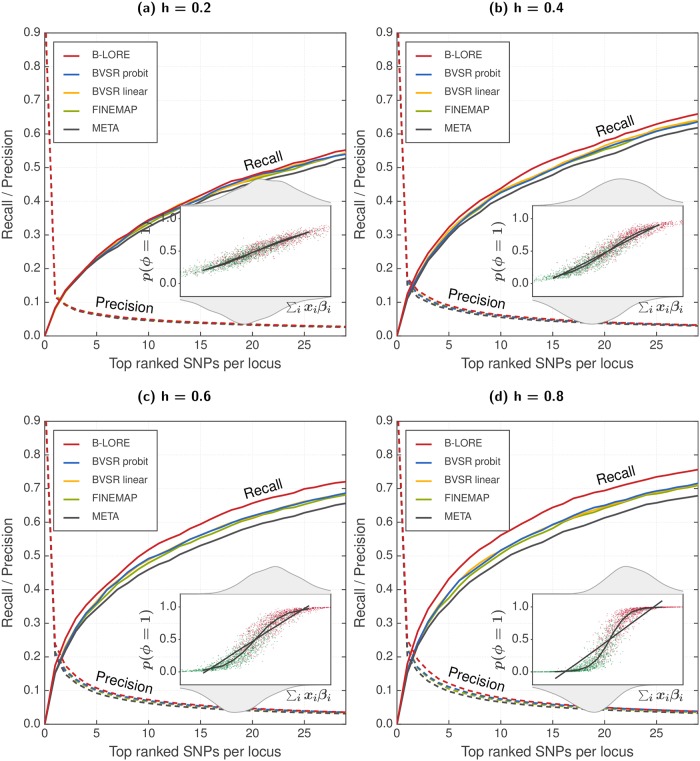
Fig 1. Multiple logistic regression improves fine-mapping in case-control GWAS.
We simulated 13082 phenotypes using 100 loci of ∼200 SNPs, as described in the main text. We compared the ranking of SNPs at each locus using recall (solid lines, left y-axis) and precision (dotted lines, right y-axis), which were averaged over 100 loci and 20 simulation replicates. All methods were run with a maximum of two causal SNPs per locus. Panels (a)–(d) show the results at different heritabilities, . Insets schematically compare the logistic model with the linear model. We plot the true ∑i xi βi from the simulation for each individual along the x-axis, and show the distribution of cases and controls on the top and bottom axes respectively. On the y-axis, we show the predicted probability of being causal using a logistic model (p(ϕ = 1), red for cases and green for controls). The black lines are quantile averages of the linear predictor and the logistic predictor. With increasing heritability, the predicted disease probability spreads away from 0.5, where the logistic model becomes increasingly better than the linear model to explain the data and B-LORE shows increasingly more recall over other methods. The improvement by B-LORE over other multi-SNP analyses is more significant than the improvement by multi-SNP over single-SNP analyses.

