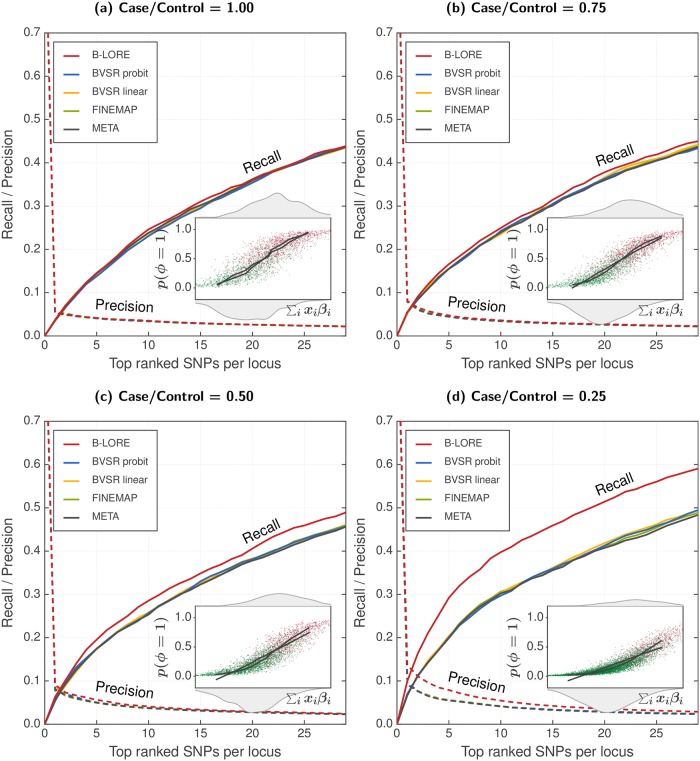
Fig 2. Multiple logistic regression improves power of GWAS with additional controls.
We simulated phenotypes with varying case/control ratio—(a) 1625/1625, (b) 1625/3250, (c) 1625/4875 and (d) 1625/6500 respectively—using 100 loci of ∼200 SNPs, as described in the main text. All simulations used . We compared the ranking of SNPs at each locus using recall (solid lines, left y-axis) and precision (dotted lines, right y-axis), which were averaged over 100 loci and 20 simulation replicates. All methods were run with a maximum of two causal SNPs per locus. Insets schematically compare logistic model with linear model (see Fig 1 for details). B-LORE shows increasingly more recall over other methods with addition of more controls, i.e., decreasing case/control ratio, because the logistic function becomes increasingly better than the linear function to model the data.

