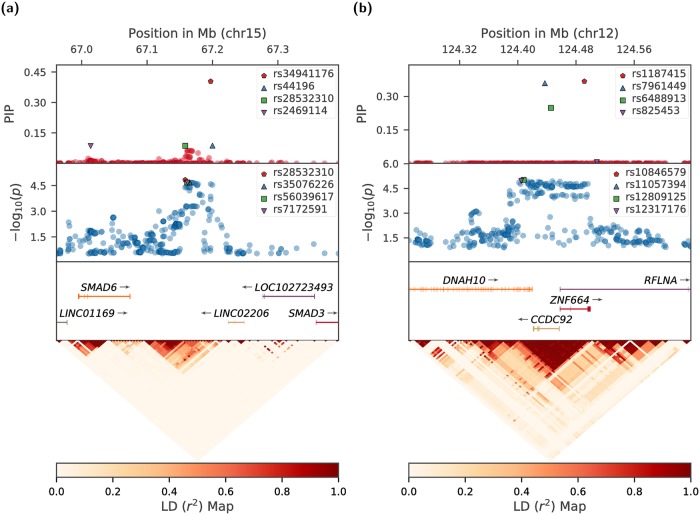
Fig 6. Representative examples of fine-mapping in CAD-associated loci.
The top parts in A and B show the posterior inclusion probability (PIP) for each SNP to be causal as predicted by B-LORE. Below we plot the −log10(p) values for each SNP obtained from SNPTEST / META. The four best SNPs predicted by B-LORE and SNPTEST / META are marked by special symbols and annotated in the legends. At the bottom, we show the genes in the region and a heatmap describing the LD between the SNPs. (a): A known locus near SMAD3. (A SNP rs56062135 at 67.45Mb was found associated with CAD by the CARDIoGRAMplusC4D study [26]). The probability for finding at least one causal SNP in the locus is Prcausal = 0.999. (b): A novel locus discovered by B-LORE, with Prcausal = 0.976.

