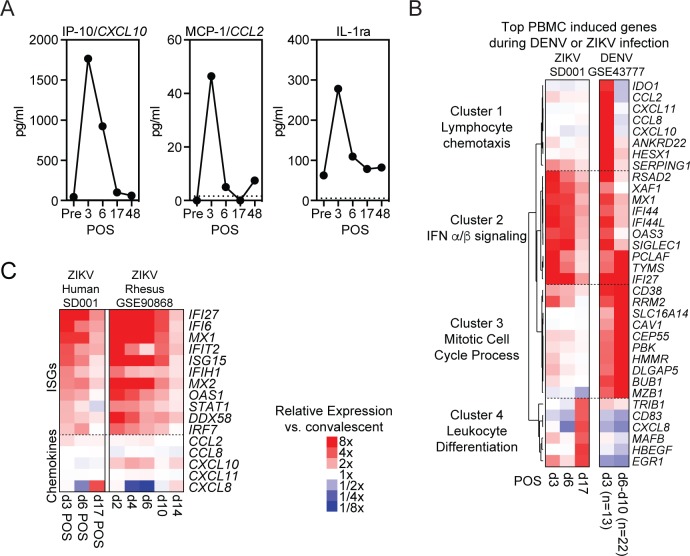
Fig 2. Systemic immune response to ZIKV infection.
(A) Serum IP-10, MCP-1 and IL1RA levels before, during and after acute ZIKV infection. Cytokines were measured in duplicate with average shown at each time point. (B) Hierarchical clustering of the top induced genes (compared to convalescent samples) in PBMCs during acute ZIKV or acute DENV (GSE43777) infections at the indicated days post-onset of symptoms. (C) Heat map of select ISGs and cytokine genes relative expression to convalescent or baseline respectively of SD001 and rhesus macaque (GSE90868) during acute ZIKV infection [33].

