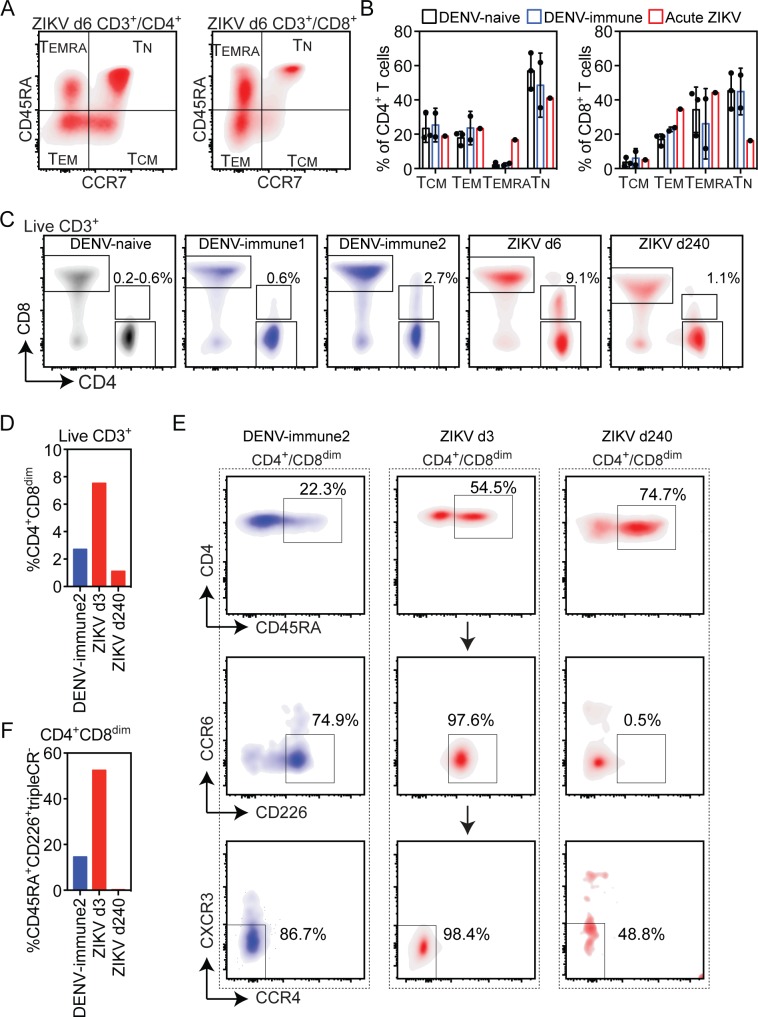
Fig 6. T cell immune phenotypes during acute ZIKV infection.
(A) Flow cytometry analysis of CD4+ and CD8+ T cell T effector memory (TEM), T effector memory RA (TEMRA), T naïve (TN) and T central memory (TCM) populations on d6 POS. (B) Relative percentages of T cell subsets on d6 POS during ZIKV infection and in 3 DENV-naïve and 2 DENV-immune control individuals. (C) Flow cytometry analysis of live CD3+ cells in one representative DENV-naïve and 2 DENV-immune controls and during acute ZIKV infection d6 and d240 POS. The percentage of live CD3+ cells that are CD4+CD8dim in each group is shown (D) Relative percentages of CD4+CD8dim among live CD3+ cells. (E) Flow cytometry analysis of the expression of CD45RA, the cytotoxicity marker CD226, and chemokine receptors CCR6, CCR4 and CXCR3 in indicated T cell populations. (F) Percent of live CD3+CD4+CD8dim T cells that are CD45RA+CD226+ and negative for CCR6, CCR4 and CXCR3 chemokine receptors.

