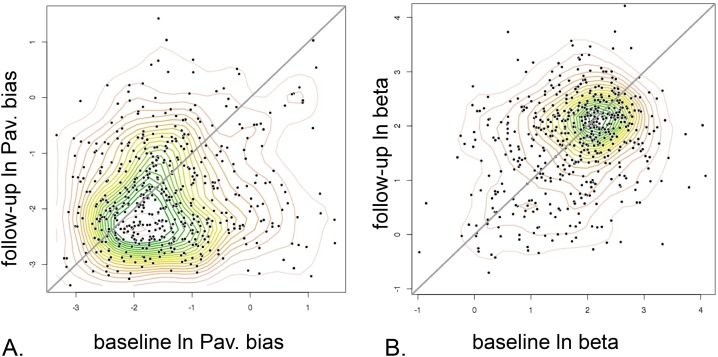
Fig 7. Parameter time dependency, long follow-up study, baseline vs. 18 months (mean) later.
A. Pavlovian Bias. The most prominent feature was a reduction in the group mean. B. Motivational exchange rate (log beta). Here there is little shift in the modal tendency. Note that log-units are used and the contours are estimated by axis-aligned, bivariate normal kernel density estimation.

