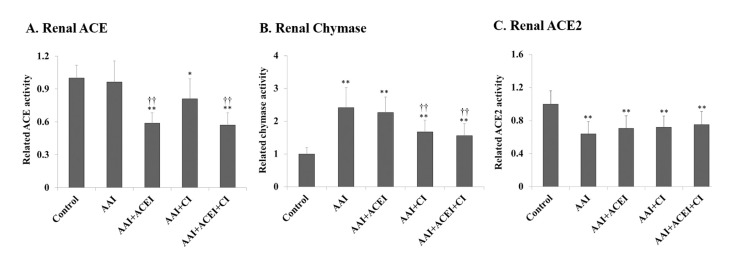
Fig 4. Changes in RAS enzyme activity in kidneys of mice with AAI-induced acute nephropathy.
Renal ACE (A), chymase (B) and ACE2 (C) activities were determined, and the related activity levels are shown as levels relative to the Control group. All values are expressed as the means ± SD from each group (n = 9). * and ** indicate p < 0.05 and p < 0.01 compared to the Control group, respectively; †† indicates p < 0.01 compared to the AAI group.

