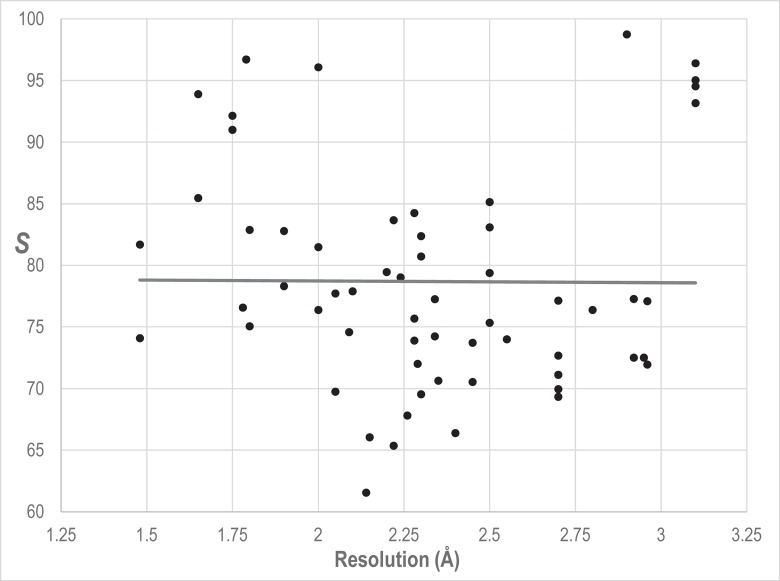
Fig 4. Regression analysis of S for 60 Ran GTPase structures versus their crystal structure resolutions.
The coefficient of determination is R2 = 0.00005, indicating that crystal structure resolution fails to explain the variability of S around its mean. The same R4 family MSA and parameters were used here as for the analyses in Table 4.

