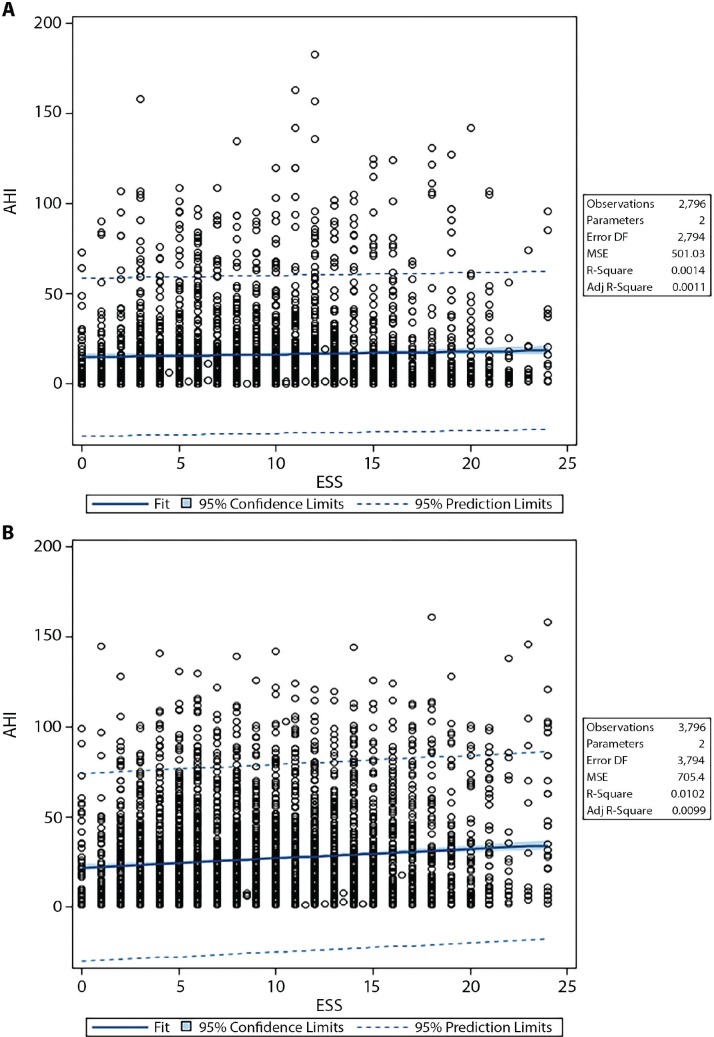
Figure 1. Fit plots showing relationship between AHI and ESS in women vs men.
(A) In women, each unit increase in ESS corresponds with a 0.16-unit increase in AHI (P = .04). (B) In men, each unit increase in ESS corresponds with a 0.51-unit increase in AHI (P < .001). The effect ratio was approximately three times greater in men. Adj = adjusted, AHI = apnea-hypopnea index, DF = degrees of freedom, ESS = Epworth Sleepiness Scale, MSE = mean squared error.

