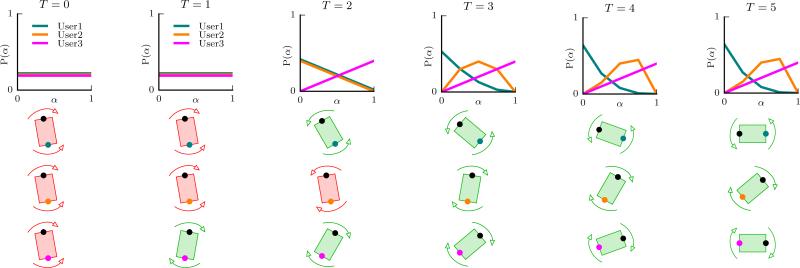
Fig. 2.
(Top row) MOMDP belief update on human adaptability α ∈ {0, 0.25, 0.5, 0.75, 1.0} for three different users in the human subject experiment of Sec. VI. Larger values of α indicate higher adaptability. (Second, third and bottom row) The rows correspond to Users 1, 2 and 3 and show the table configuration at each time-step of task execution. Columns indicate different time-steps. Red color indicates human and robot disagreement in their actions, in which case the table does not rotate. User 1 (teal dot) insists on their initial strategy throughout the task and the robot (black dot) complies, whereas Users 2 and 3 (orange and magenta dot) adapt to the robot.

