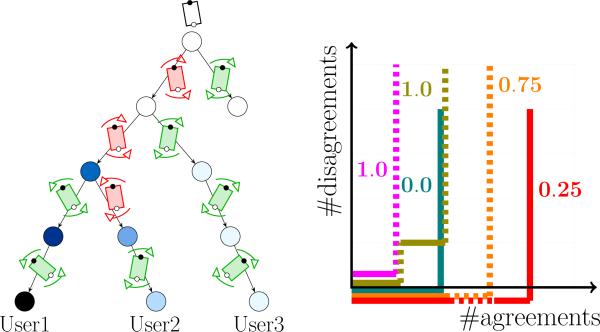
Fig. 5.
(Left) Different paths on MOMDP policy tree for human-robot (white/black dot) table-carrying task. The circle color represents the belief on α, with darker shades indicating higher probability for smaller values (less adaptability). The white circles denote a uniform distribution over α. User 1 is non-adaptive, whereas Users 2 and 3 are adaptive. (Right) Instances of different user behaviors in the first round of the Mutual-adaptation session. A horizontal/vertical line segment indicates human and robot disagreement/agreement on their actions. A solid/dashed line indicates a human rotation towards the sub-optimal/optimal goal. The numbers denote the most likely estimated value of α.

