
Figure 2.
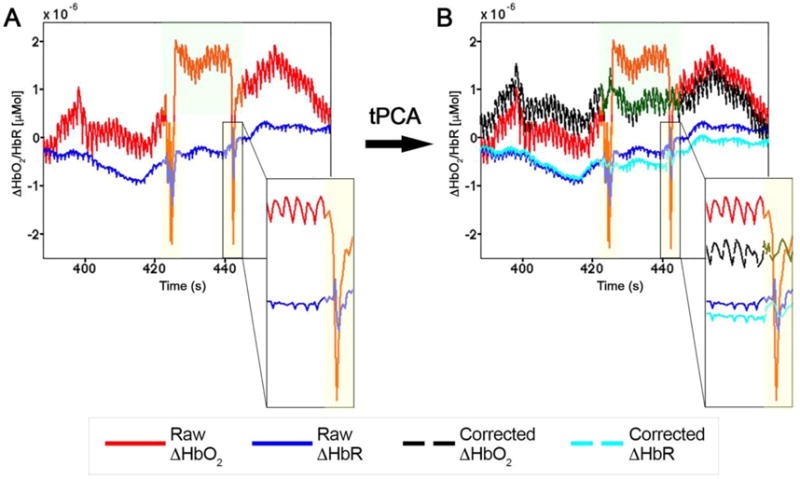
Example of motion artifacts in raw fNIRS signals (A) as shifts from baseline values (green shaded areas) and fast spikes (yellow shaded areas), where HbO2 and HbR are correlated. Panel B shows the effect of the application of the tPCA approach for the correction of motion errors. HbO2 and HbR become anti-correlated after being properly corrected. Data refer to the study by Pinti et al., 2015.