
Figure 4.
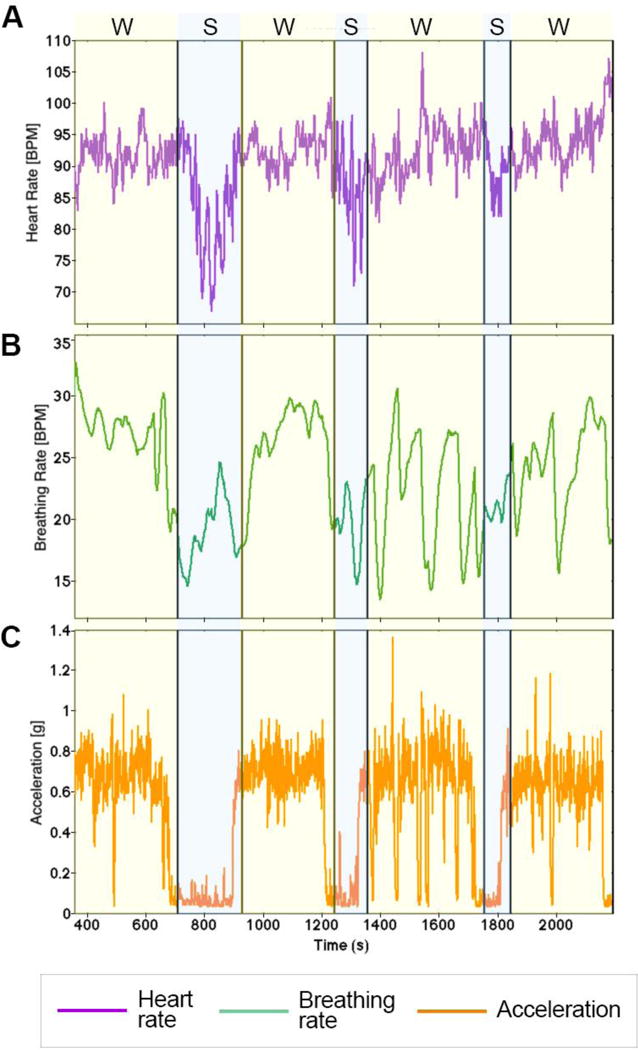
Heart rate (A), breathing rate (B), and acceleration (C) data referring to one participant undertaking the experiment described in Pinti et al. (2015). Yellow shaded areas indicate the conditions involving walking (W), while blue shaded areas represent the phases in which the participant was standing (S).