. 2018 Dec 28;7:e38889. doi: 10.7554/eLife.38889

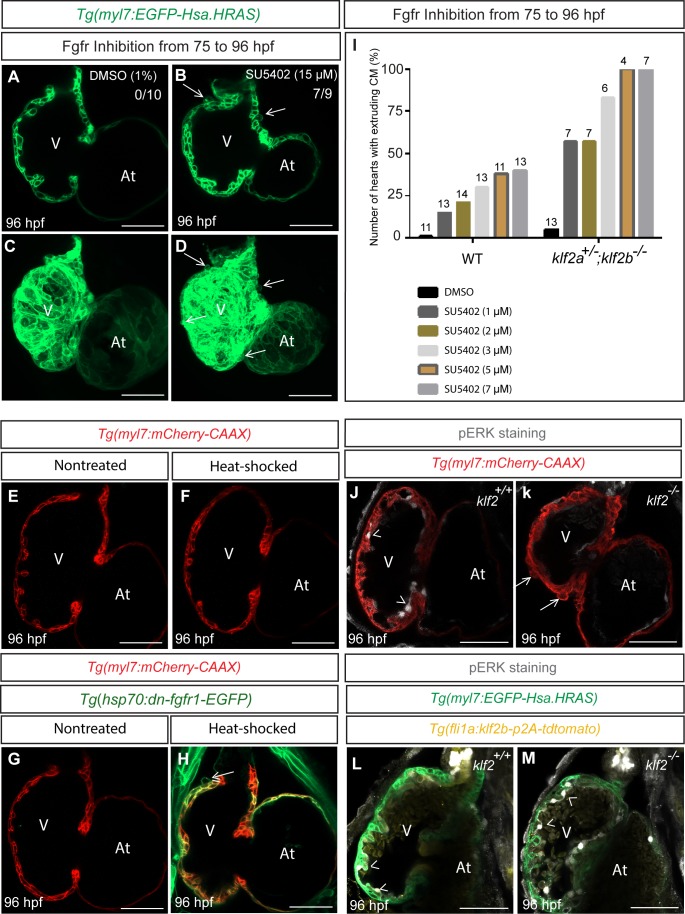
Figure 6. Inhibition of Fgfr signaling can lead to cardiomyocyte extrusion in WT animals.

(A–D) Confocal images of 96 hpf hearts; WT animals treated with DMSO as a control or FGFR inhibitor (SU5402) from 75 to 96 hpf; maximum intensity projections of hearts in (A) and (D) are shown in (C) and (D) respectively; arrows point to extruding cardiomyocytes. (E–H) 75 hpf Tg(myl7: mCherry-CAAX) (E–F) or Tg(hsp70:dn-fgfr1-EGFP);Tg(myl7: mCherry-CAAX) (G–H) animals were heat-stressed at 39°C for 1 hr (F and H) and their hearts imaged at 96 hpf; arrow in (H) points to an extruding cardiomyocyte (n = 9/13 hearts). (I) klf2a+/-; klf2b-/- animals are more likely than WT siblings to exhibit cardiomyocyte extrusion upon Fgfr inhibition; number of treated larvae for each condition is shown above the individual columns. (J–K) Hearts of 96 hpf Tg(myl7: mCherry-CAAX); klf2 +/+ or klf2 -/- animals immunostained for pERK. (L–M) Hearts of 96 hpf Tg(fli1a:klf2b-p2A-tdTomato);Tg(myl7:EGFP-Hsa.HRAS); klf2 +/+ or klf2 -/- animals immunostained for pERK. Arrows and arrowheads point to extruding cardiomyocytes and pERK positive endocardial cells, respectively; V: ventricle, At: atrium; scale bars, 50 µm.

Figure 6—source data 1. Upregulation of aldh1a2 and downregulation of cyp26b1 in klf2 mutant hearts compared to wild-type.
DOI: 10.7554/eLife.38889.030
Figure 6—source data 2. Hedgehog signaling is affected in klf2 mutant hearts.
DOI: 10.7554/eLife.38889.031
Figure 6—source data 3. fgf ligand and receptor genes are downregulated in klf2 mutant hearts.
DOI: 10.7554/eLife.38889.032

Figure 6.

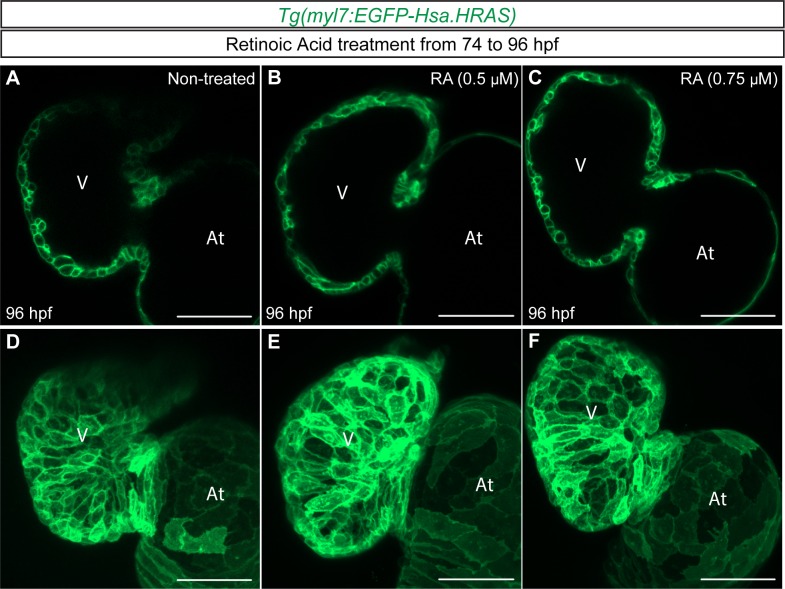
Figure 6—figure supplement 1. Increased Retinoic Acid signaling does not cause cardiomyocyte extrusion.

Figure 6—figure supplement 1.

(A–F) 2D confocal images (mid-sagittal sections) of 96 hpf WT hearts, non-treated (n = 11 hearts) (A and D) or treated with retinoic acid (0.5 µM) (n = 13 hearts) (B and E) or (0.75 µM) (n = 10 hearts) (C and F) from 74 to 96 hpf; maximum intensity projections of hearts in (A) , (B) and (C) are shown in (D) , (E) and (F), respectively. V: ventricle, At: atrium; scale bars, 50 µm.
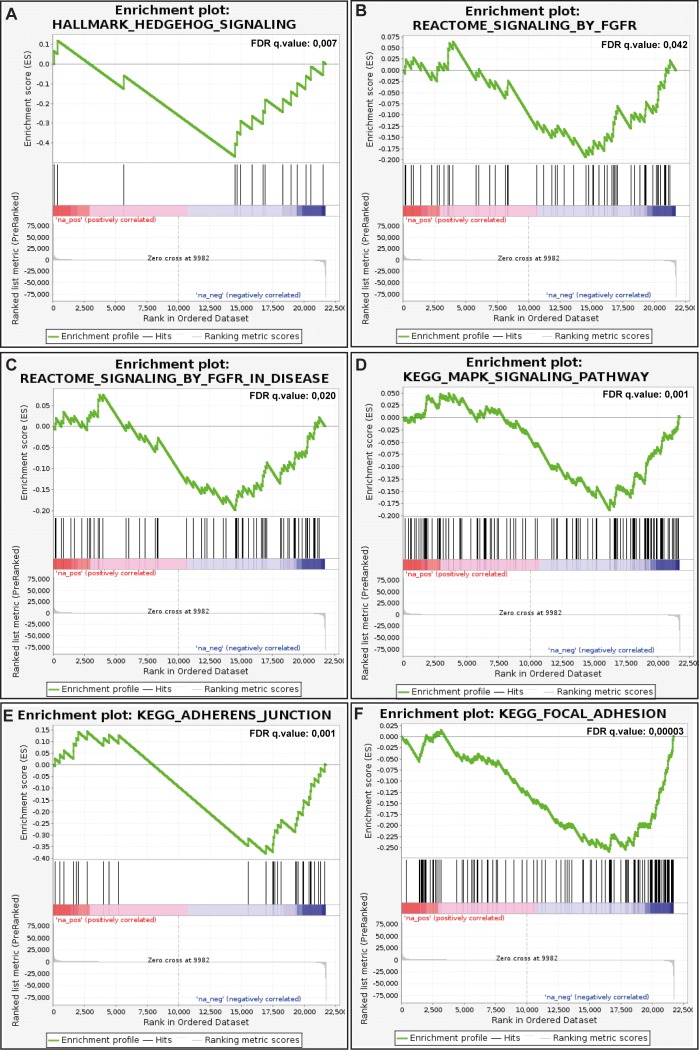
Figure 6—figure supplement 2. Broad GSEA enrichment plots of selected down-regulated gene sets.

Figure 6—figure supplement 2.

(A–F) The Broad gene set enrichment algorithm (GSEA) was used to identify gene sets down-regulated in klf2 mutant hearts. The gene sets were selected at an FDR < 0.05 from the Hallmark, KEGG and Reactome databases. Enrichment plots show an ordered list of genes (black vertical bars) sorted from the most up-regulated (left) to the most down-regulated (right). Enrichment scores (green) show overrepresentation of down-regulated genes in these gene sets.
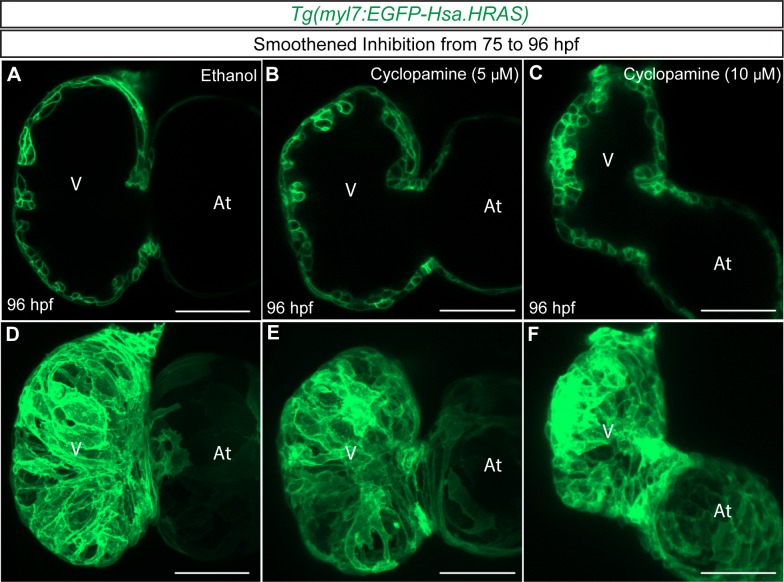
Figure 6—figure supplement 3. Inhibition of Hedgehog signaling does not cause cardiomyocyte extrusion.

Figure 6—figure supplement 3.

(A–F) 2D confocal images (mid-sagittal sections) of 96 hpf WT hearts, treated with ethanol (n = 15 hearts) (A and D), or the Smoothened inhibitor Cyclopamine (5 µM) (n = 17 hearts) (B and E) or (10 µM) (n = 21 hearts) (C and F) from 75 to 96 hpf; maximum intensity projections of hearts in (A) , ( B) and (C) are shown in (D) , (E) and F), respectively. V: ventricle, At: atrium; scale bars, 50 µm.
Figure 6—figure supplement 4. mRNA levels of fgf ligand and receptor genes in WT and klf2 mutant hearts.
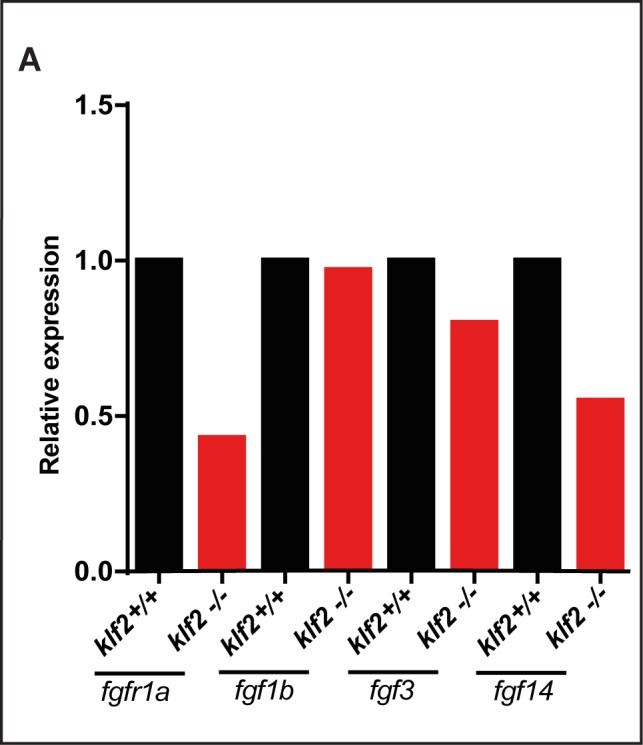
Figure 6—figure supplement 4.

(A) qPCR analysis of fgfr1a, fgf1b, fgf3 and fgf14 expression in WT and klf2 mutant hearts at 96 hpf (95 embryos were pooled for each sample). Ct and dCt values are listed in Supplementary file 3.
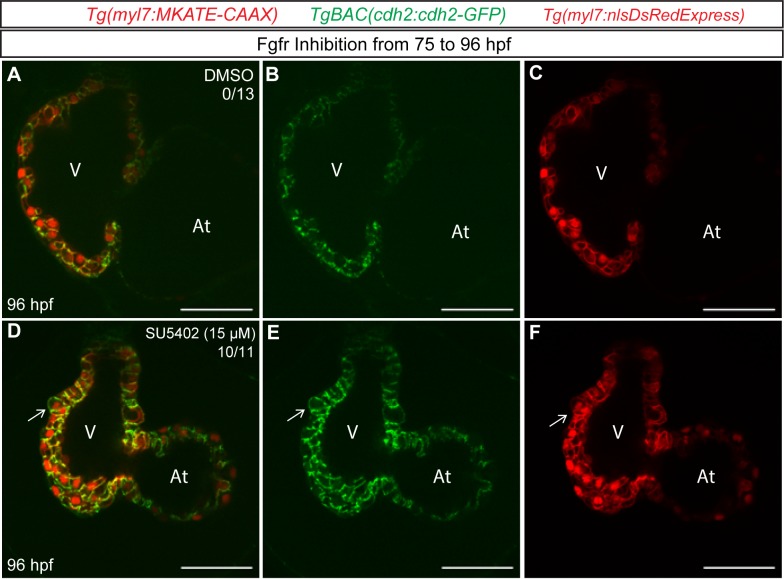
Figure 6—figure supplement 5. Inhibition of Fgfr signaling can lead to Cdh2-GFP mislocalization in cardiomyocytes.

Figure 6—figure supplement 5.

(A–F) 2D confocal images (mid-sagittal sections) of 96 hpf hearts treated with DMSO (A–C) or SU5402 (D–F) from 75 to 96 hpf; arrows point to extruding cardiomyocytes. V: ventricle, At: atrium; scale bars, 50 µm.
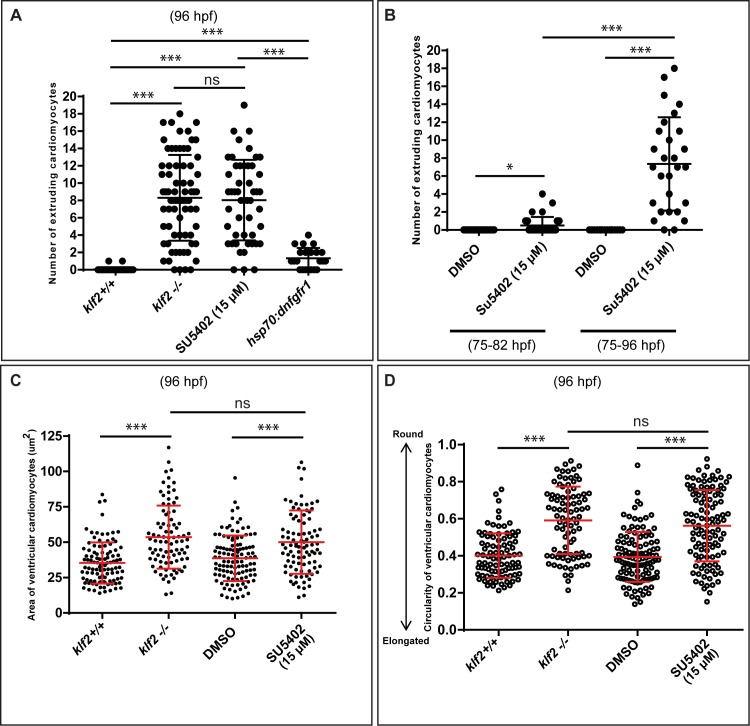
Figure 6—figure supplement 6. Additional quantification of the cardiomyocyte extrusion phenotype upon Fgfr inhibition.

Figure 6—figure supplement 6.

(A) Number of extruding cardiomyocytes in 96 hpf hearts. (B) Number of extruding cardiomyocytes upon inhibition of Fgfr signaling using the SU5402 inhibitor; dots in (A) and (B) represent individual hearts. Area (C) and circularity (D) of 96 hpf cardiomyocytes in ventricular outer curvature; dots in (C) and (D) represent individual cardiomyocytes.
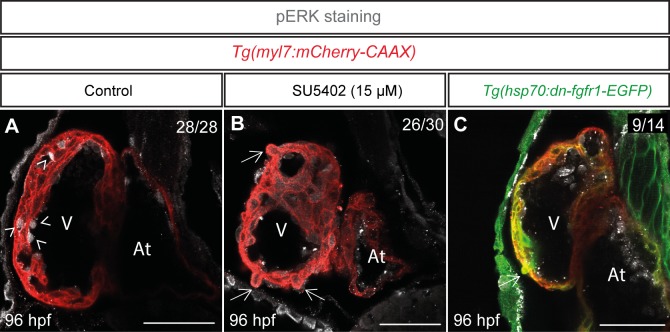
Figure 6—figure supplement 7. Fgf signaling is required for ERK phosphorylation in endocardial cells.

Figure 6—figure supplement 7.

(A–C) pERK immunostaining of control, SU5402 treated and heat-shockedTg(hsp70:dn-fgfr1-EGFP) hearts. Arrows and arrowheads point to extruding cardiomyocytes and pERK-positive endocardial cells, respectively; V: ventricle, At: atrium; scale bars, 50 µm.
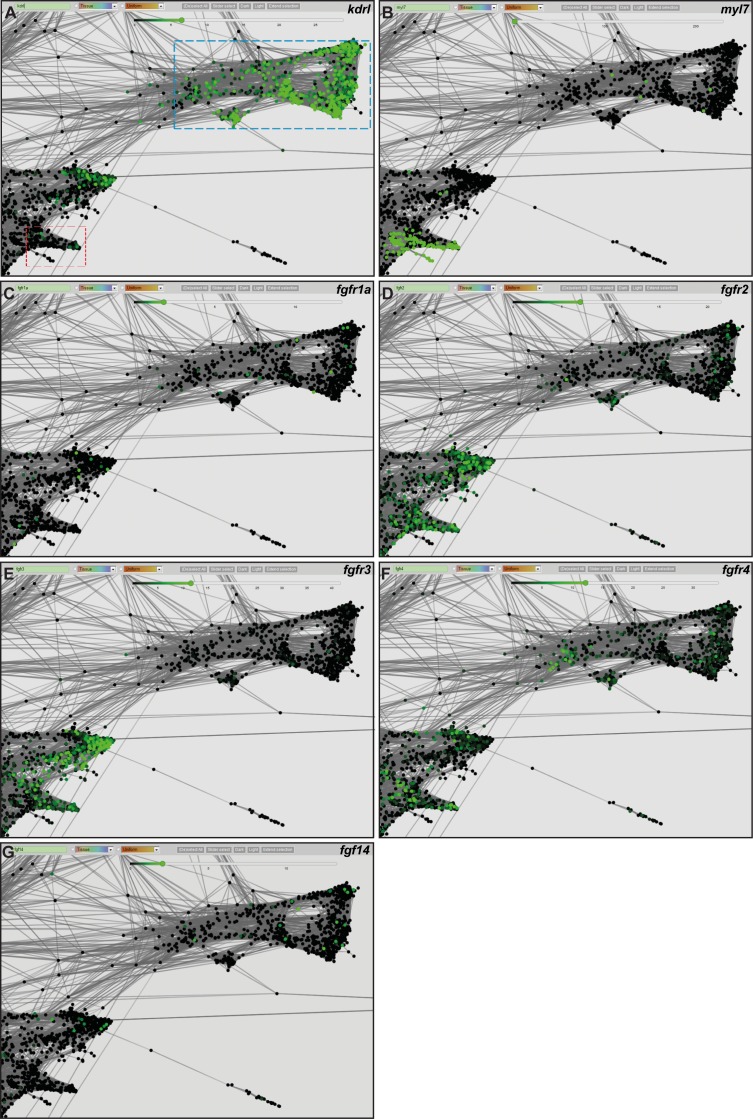
Figure 6—figure supplement 8. Single cell graphs of fgf receptor and ligand genes expressed in zebrafish embryonic endothelium and heart.

Figure 6—figure supplement 8.

(A–F) Single cell graphs of kdrl (A), myl7 (B), fgfr1a (C), fgfr2 (D), fgfr3 (E), fgfr4 (F), and fgf14 (G) genes; blue and red boxes outline endothelium and heart, respectively.
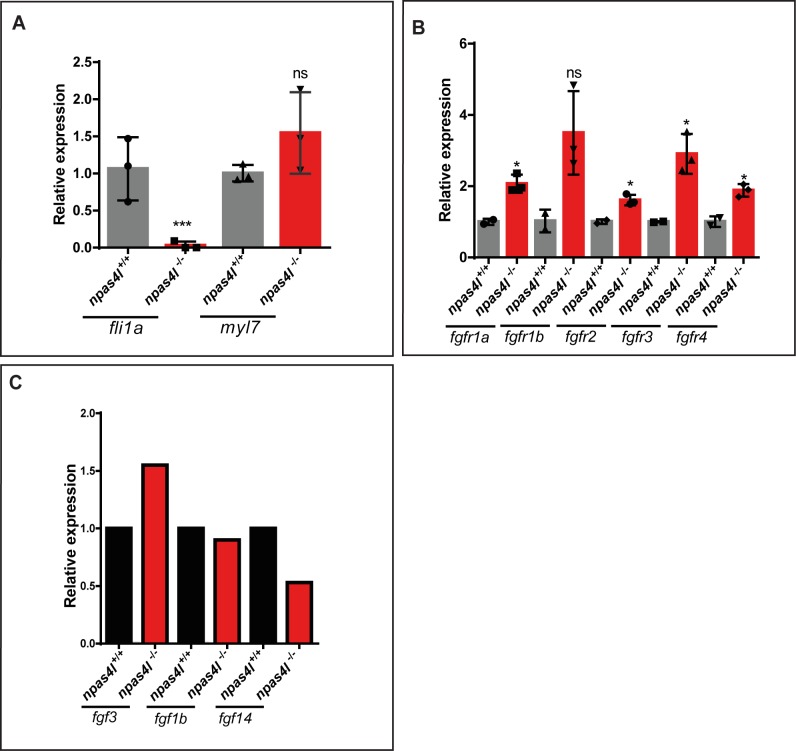
Figure 6—figure supplement 9. mRNA levels of fgf ligand and receptor genes in WT and npas4l mutant hearts.

Figure 6—figure supplement 9.

(A–C) qPCR analysis of fli1a and myl7 (A), fgfr1a, fgfr1b, fgfr2, fgfr3 and fgfr4 (B), fgf 3, fgf1b and fgf14 (C) mRNA levels in 75 hpf npas4l WT and mutant hearts; n = 3 biological replicates; values represent means ±s.e.m.; *p≤0.05, ***, p≤0.001, ns (not significant), by Student’s t-test in (A) and (B); 75 embryos were pooled for each sample in (C). Ct and dCt values are listed in Supplementary file 3. V: ventricle, At: atrium; scale bars: 0.5 mm (A–F), 50 µm (G–O).