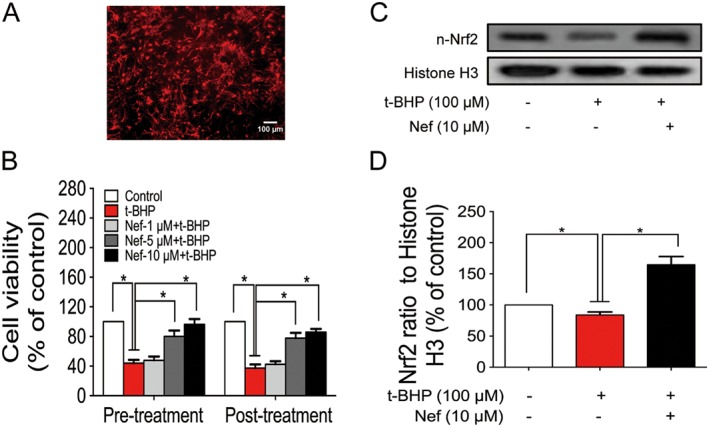
Figure 5.

Effect of Nef on primary cortical neurons. Cell identification of primary cortical neuron was determined with MAP‐2 antibody (A). Cell viability was determined by the MTT assay (B). The expression of n‐Nrf2 was determined by Western blotting (C, D). Data are expressed as the mean ± SD and were analysed by ANOVA. *P < 0.05. n‐Nrf2, nucleus‐Nrf2.
