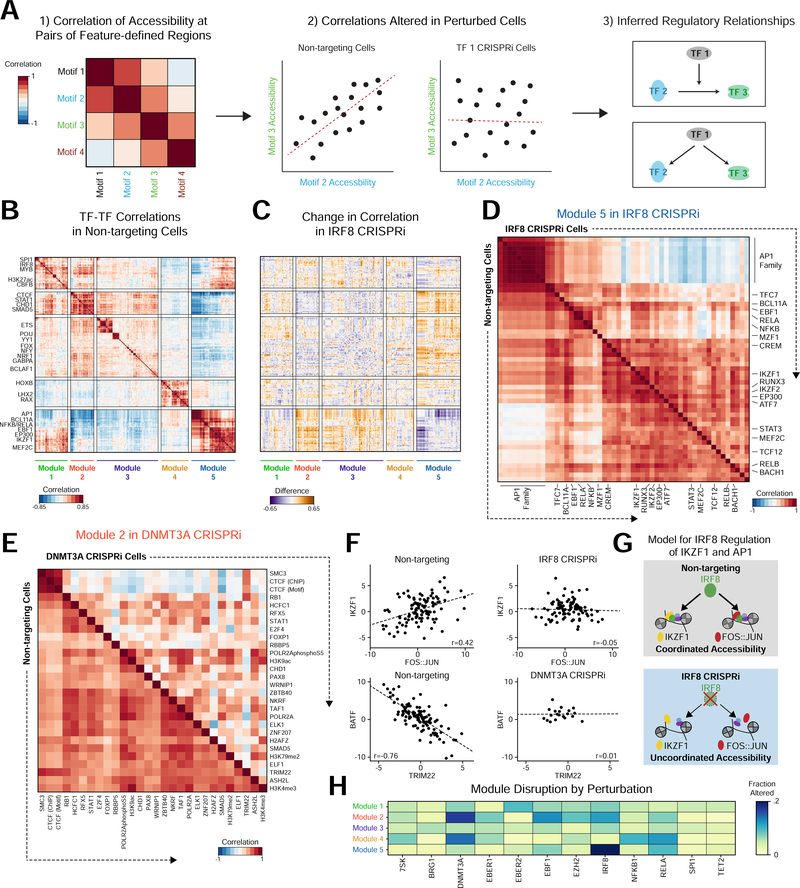
Figure 3. Perturbations influence inter-cellular variability and correlated activity across features.
(a) Example workflow identifying genomic features with correlated activity across cells. Left: heatmap indicating correlation of motif activity across cells. Middle: Comparing non-targeting (NT) control cells to perturbed cells identifies motif pairs that change in correlation as a result of perturbation. Right: Functional relationships constrain hypothetical regulatory networks. (b) Heatmap of Pearson correlations between features in NT cells. (c) Heatmap displaying the difference in correlations between NT and IRF8 knockdown cells. (d) Heatmap of Module 5 feature correlations in NT (bottom half) and IRF8 (top half) knockdown cells. (e) Heatmap displaying Module 2 feature correlations in NT cells (bottom half) and DNMT3A (top half) knockdown cells. (f) Scatter plots of accessibility for cells with line of linear best fit demonstrating correlation in specific conditions. (g) Hypothetical model of IRF8 co-factor activity with AP-1 and IKZF1. (h) Heatmap of the fraction of altered feature-feature correlations within modules by perturbation, showing specific effects on particular modules in different perturbations.

