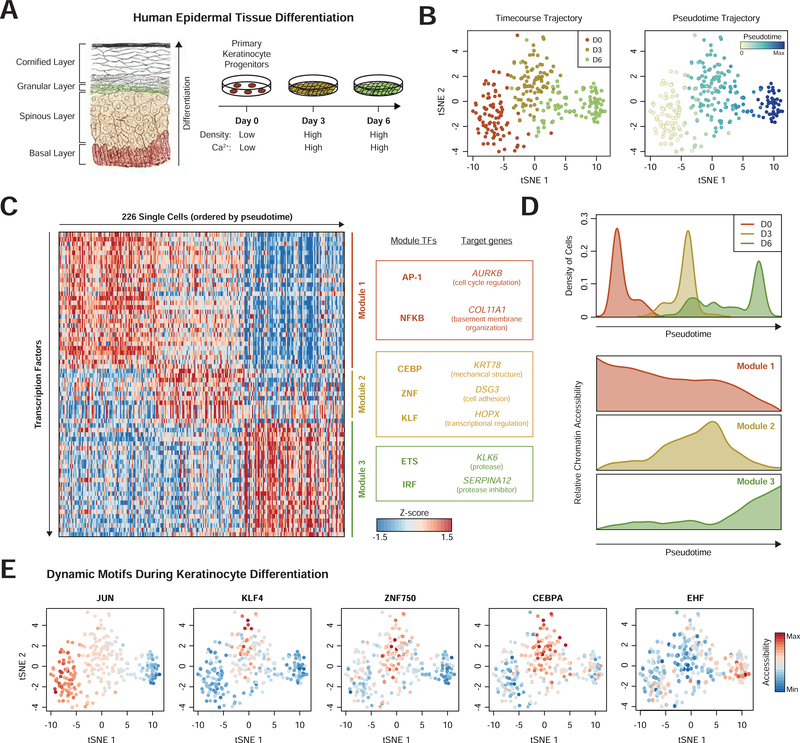
Figure 5. Modules of transcription factors exhibit distinct temporal activity in epidermal differentiation.
(a) Schematic of human epidermis and cell culture model of epidermal differentiation (Gray, Henry, 1918). (b) tSNE projection of TF feature activity for epidermal cells labeled by differentiation day (left) or pseudotime (right). (c) Heatmap of cells ordered by pseudotime (columns) versus TF feature activity (filtered for motifs with dynamic activity). Modules represent collections of TF features with similar temporal profiles. Target genes are proximal (<50kb) to genomic regions associated with that module. (d) Top: histogram of pseudotime values for cells from each day of differentiation. Bottom: average accessibility of each module identified in (c). (e) tSNE projectionsshowing TF activity dynamics during differentiation.

