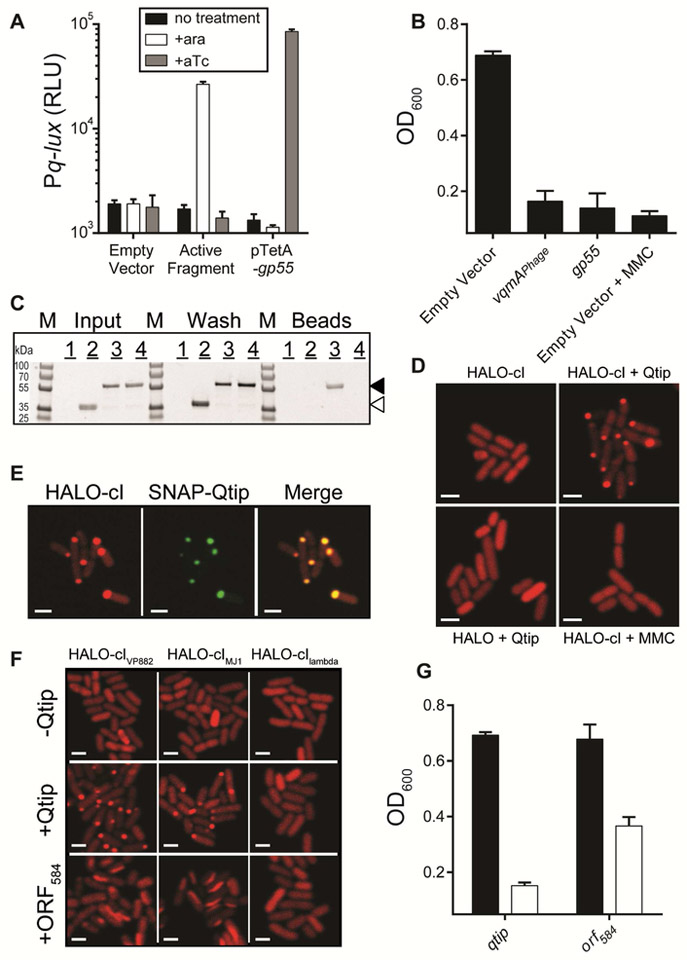
Figure 4: VqmAPhage activates production of Qtip, a phage-encoded small protein that inactivates the cI repressor by sequestration.
(A) E. coli carrying a plasmid harboring Pq-lux, cI, and arabinose inducible vqmAPhage and a second empty vector, the vector containing a phage genomic fragment encoding gp55 (denoted Active Fragment), or the cloned gp55 gene under the tetA promoter. Where indicated, arabinose and aTc were provided at final concentrations of 0.2% and 100 ng mL−1, respectively. (B) Growth of V. parahaemolyticus harboring phage VP882 and a vector control, the vector with arabinose inducible vqmAPhage, or the vector with aTc inducible gp55. Arabinose, aTc, and MMC were added at 0.2%, 10 ng mL−1, and 50 ng mL−1 respectively. (C) SDS-PAGE analysis of proteins isolated from the following: Sample 1: cells producing HIS-Gp55 alone. Sample 2: cells producing HIS-Gp55 combined with cells producing the HALO-tag (not fused to cI). Sample 3: cells producing HIS-Gp55 combined with cells producing HALO-cI. Sample 4: cells producing HALO-cI in the absence of HIS-Gp55. Proteins were isolated by applying the indicated lysates to cobalt beads, which bind the HIS-tag fused to Gp55. Thus, proteins interacting with HIS-Gp55 are retained on the beads. Lysates (Input), wash (Wash), and protein remaining on cobalt beads (Beads). The gel was stained for HALO using HALO-TMR. Locations of HALO-cI and the HALO-tag are marked with black and white arrowheads, respectively. No other obvious protein bands were present in the bead sample containing HALO-cI and HIS-Gp55 suggesting that Gp55 is specific for cI. Marker (M, PageRuler Plus; representative bands are labeled). (D) Confocal microscopy of E. coli producing HIS-HALO-cI in the absence of Qtip (top left), HIS-HALO-cI combined with 100 ng mL−1 aTc induction of qtip (top right), HIS-HALO (not fused to cI) combined with 100 ng mL−1 induction of qtip (bottom left), HIS-HALO-cI combined with 250 ng mL−1 MMC (bottom right). (E) Confocal microscopy of E. coli producing HIS-HALO-cI and SNAP-Qtip. HALO-cI was visualized with HALO-TMR and SNAP with JF503. The medium contained 100 ng mL−1 aTc. (F) Confocal microscopy of E. coli producing HALO-tagged cIVP882, cIMJ1 or cIlambda (top row), co-producing Qtip (middle row) or co-producing ORF584 (bottom row). Qtip and ORF584 production were induced with 100 ng mL−1 aTc. (G) Growth of V. parahaemolyticus carrying phage VP882 and aTc inducible qtip or orf584. Black; no aTc, white; 10 ng mL−1 aTc. All scale bars are 3 pm. Data in A, B, and G are represented as mean ± std with n=3 biological replicates. See also Figures S4 and S5.

