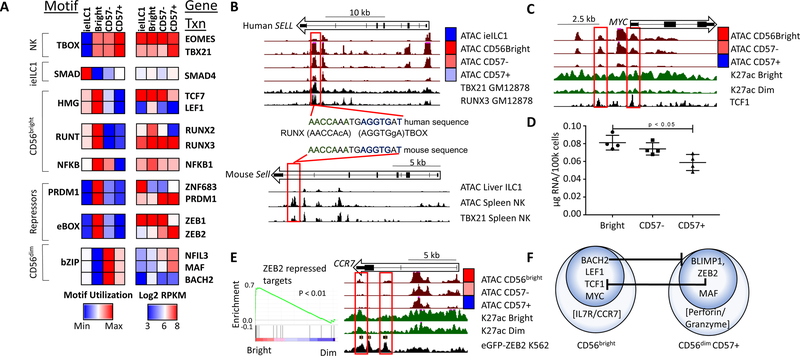
Figure 5. Enriched TF motifs in NK and ieILC1 regulomes.
A) Motif utilization for differentially regulated enhancers based on ATAC data. Motif utilization is represented as relative levels ranging from low (blue) to high (red) and is pre-filtered for significance (p < 0.001, binomial test). Motifs were assigned to a TF family using HOMER and hocomoco databases. The right panel shows expression of selected genes in the corresponding TF family (blue: 23 intensity, red: 28 RPKM). B) UCSC screenshots of the human (top) and mouse SELL locus (bottom) showing ATAC data from indicated cell types. The bottom tracks in each panel show ChIP-seq data for TBX21 or RUNX3 in either a human B cell line (GM12878) or mouse splenic NK cells. The middle panel shows a conserved RUNX-TBOX composite motif for one of the enhancers. C) UCSC screenshot of the MYC locus. The black track (bottom) represents TCF7 ChIP-seq from K562 cells (ENCODE). D) Total RNA per cell for each NK subset. E) GSEA enrichment of ZEB2 repressed genes from Claudia X. et al, 2015, showing relative levels in CD56bright and CD56dim NK transcriptomes. E) UCSC screenshot of the CCR7 locus with the bottom track showing ChIP-seq data for eGFP-ZEB2 from the K562 cell line (ENCODE). F) A representation of CD56bright and CD56dim NK transcription factor regulatory circuits, as predicted from combined expression and motif analysis. Also included are key effector genes of both subsets.

