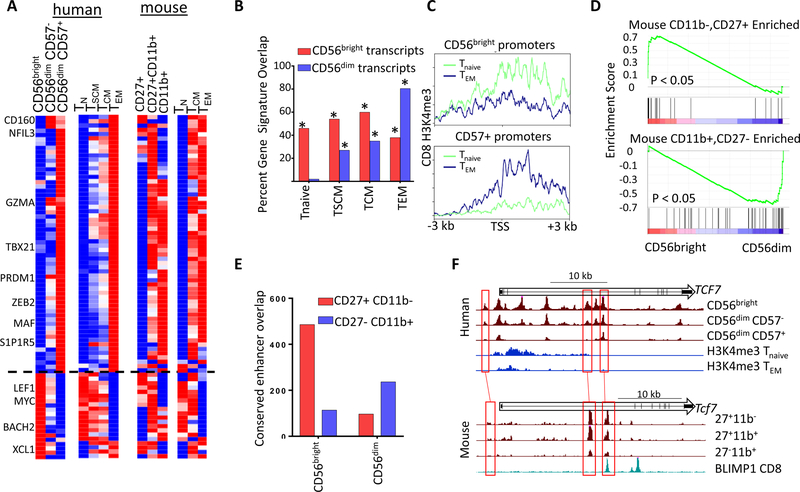
Figure 6. Evolutionarily conserved signatures of NK and CD8 cells.
A) Transcripts differentially regulated in peripheral human NK and CD8 subsets (left), and expression of orthologous genes from mouse cells (right). Heatmaps show relative probe intensity (human CD8 data) or RPKM values of transcripts across replicates. B) Percentage of CD56bright or CD57+ specific genes overlapping CD8 Tnaive, TSCM, TCM and TEM gene sets. * p < 0.01 Binomial enrichment. C) Average Tnaive and TEM H3K4me3 density across promoters specifically accessible in CD56bright or CD57+ cells. D) GSEA enrichment of genes selectively expressed in CD27+CD11b- (left) or CD27-CD11b+ (right) cells from Robinette M. L. et al, 2015 showing relative levels in CD56bright and CD56dim NK transcriptomes. E) Overlap between conserved CD56bright and CD56dim cell- type selective enhancers with either CD27+CD11b- or CD27-CD11b+ ATAC peaks. F) UCSC screenshots of the human (top) and mouse (bottom) TCF7 locus showing ATAC or H3K4me3 data from indicated cell type. The bottom track for mouse data shows ChIP-seq data for BLIMP1 from mouse CD8 cells.

