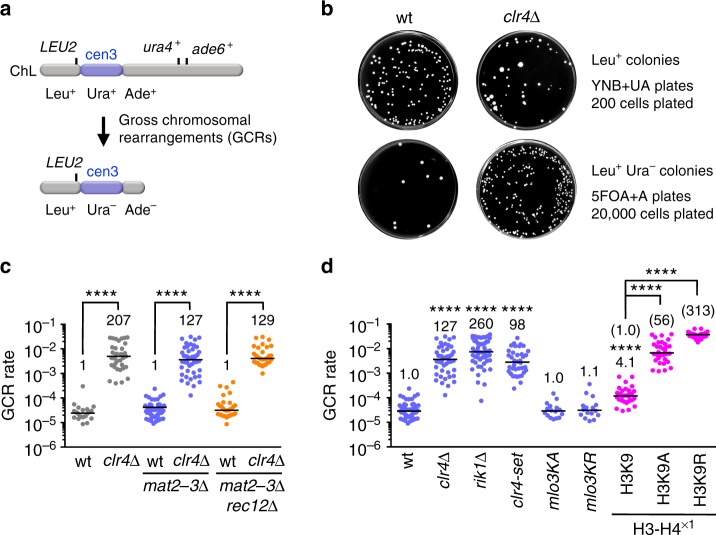
Fig. 1.
Clr4 methyltransferase suppresses gross chromosomal rearrangements (GCRs) through H3K9 methylation. a Illustration of an extra-chromosome ChL. Positions of LEU2, ura4+, ade6+, and centromere 3 (cen3) are indicated. When GCRs associated with the loss of ura4+ and ade6+ take place, Leu+ Ura+ Ade+ cells become Leu+ Ura– Ade– cells. b Wild-type and clr4∆ strains (TNF5676 and 5702, respectively) grown in EMM + UA were plated onto YNB + UA (2 × 10² cells) and 5FOA + A (2 × 10⁴ cells) media to count Leu+ and Leu+ Ura– colonies, respectively. Plates were incubated at 30 °C for 6–9 days. wt, wild type. c GCR rates of wild-type, clr4∆, mat2-3∆, mat2-3∆ clr4∆, mat2-3∆ rec12∆, and mat2-3∆ rec12∆ clr4∆ strains (TNF3896, 5440, 5676, 5702, 5701, and 5766, respectively). Each dot represents the GCR rate determined using a single colony formed on EMM + UA plates in scatter plots. Lines represent the median. The GCR rate relative to that of the wild-type clr4+ strain is indicated on the top of each column. Statistical significance of differences between pairs of strains was determined using the two-tailed Mann–Whitney test. ****P < 0.0001. d GCR rates of wild-type, clr4∆, rik1∆, clr4-set, mlo3KA, mlo3KR, H3K9, H3K9A, and H3K9R strains in the mat2-3∆ background (TNF5676, 5702, 6121, 6958, 6155, 6157, 5738, 6223, and 5802, respectively). The GCR rate relative to that of wild type is indicated on the top of each column. In the cases of H3K9, H3K9A, and H3K9R strains, the GCR rate relative to that of the wild-type H3K9 strain is also shown in parentheses. Statistical significance of differences relative to wild type (the top of each column), and of differences between pairs of strains was determined using the two-tailed Mann–Whitney test

