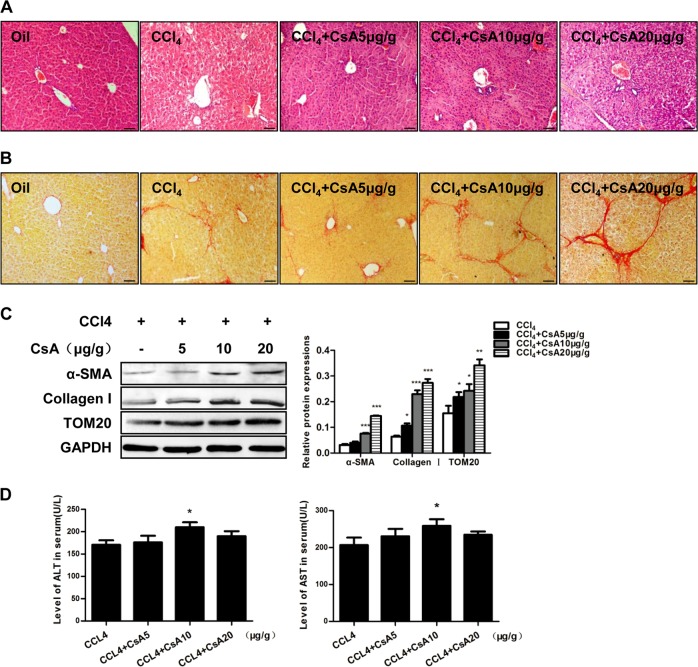
Fig. 4. Inhibition of mitophagy aggravates hepatic fibrosis in mice.
a H&E staining of liver sections from mice; n = 6 per group; scale bar, 50 μm. b Sirius red staining of collagen in mouse liver sections; n = 6 per group; scale bar, 50 μm. c Representative western blots of TOM20, collagen I and α-SMA. Bar graph represents the mean ± SEM of three different experiments. *P < 0.05; **P < 0.01; and ***P < 0.001 vs. the indicated groups. d Serum levels of ALT and AST in the indicated mice. Bar graph represents the mean ± SEM; n = 6 per group. *P < 0.05 vs. the indicated groups

