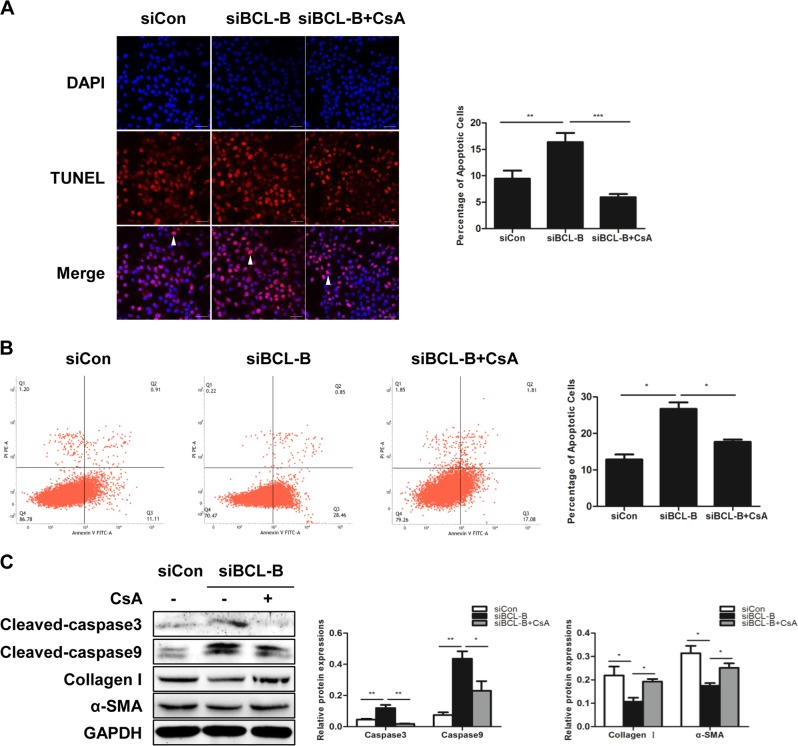
Fig. 6. BCL-B inhibits apoptosis by suppressing mitophagy.
a TUNEL staining of LX2 cells from the indicated groups; scale bar, 25 μm. Bar graph represents the mean ± SEM. **P < 0.01 and ***P < 0.001 vs. the indicated groups. b Annexin V-FITC/PI double-staining and flow cytometry analysis of LX2 cells. Bar graph represents the mean ± SEM. *P < 0.05 vs. the indicated groups. c Representative western blots of cleaved caspase3, cleaved caspase9, collagen I and α-SMA in LX2 cells. Bar graph represents the mean ± SEM of three different experiments. *P < 0.05 and **P < 0.01 vs. the indicated groups

