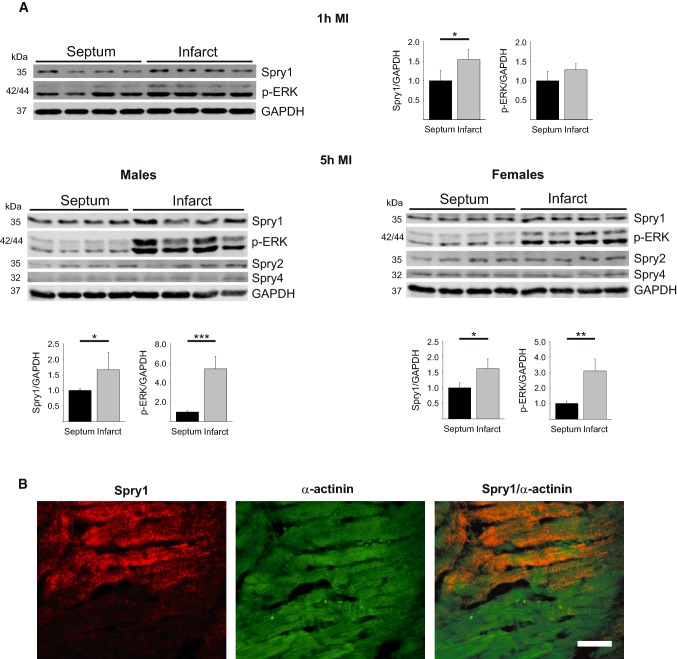
Fig. 1.
Analysis for Spry1 expression in ischemic myocardium. a Wild-type male mice were subjected to myocardial infarction (MI) for 1 and 5 h, and female mice for 5 h. Heart tissues from infarcted area and remote area (septum) were collected. Shown is immunoblot analysis of Spry1, phosphorylated extracellular signal-regulated kinase (p-ERK), Spry2, Spry4 and glyceraldehyde 3-phosphate dehydrogenase (GAPDH). Quantification of immunoblot analysis of Spry1 and p-ERK. GAPDH was used as a loading control. Data are shown as fold versus septum. N = 4–5; *P < 0.05, **P < 0.01, ***P < 0.001 versus septum. b Spry1fl/fl mice were subjected to ischemia–reperfusion (I/R) injury and heart tissue was collected after 6 h of reperfusion. Shown is the immunofluorescence staining of formalin fixed and paraffin-embedded tissue sections from infarct area for Spry1 and cardiomyocyte marker α-actinin. Scale bar 40 µm

