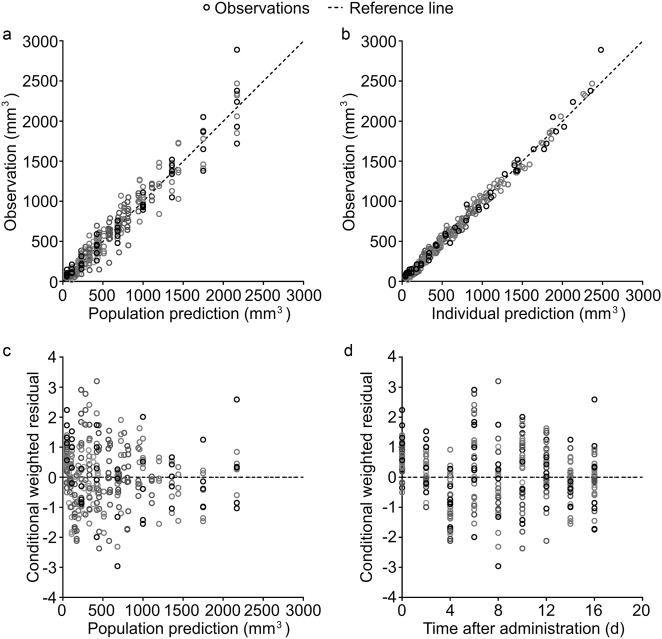
Fig. 5.
Goodness-of-fit (GOF) plots of the PK-PD model of pool data. a Observations versus population predictions. b Observations versus individual predictions. c Conditional weighted residuals versus population predictions. d Conditional weighted residuals versus time. The dashed lines are reference lines of y = x for a and b, and y = 0 for c and d, and the empty circles represent the observations

