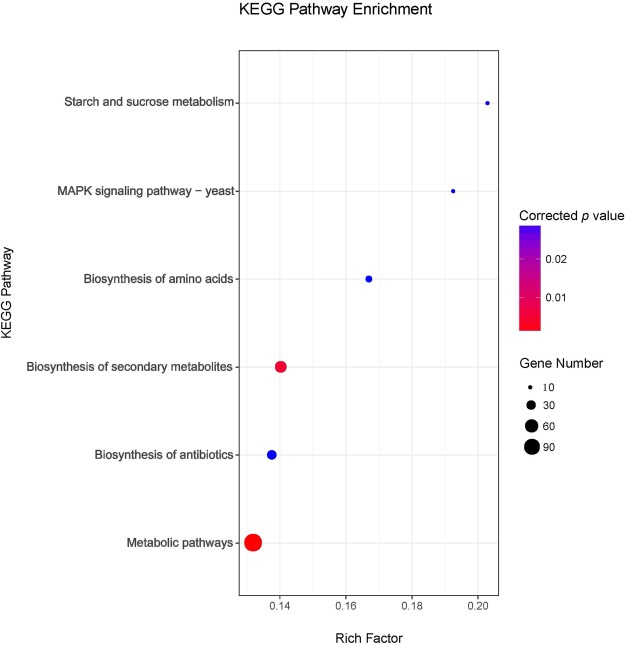
Figure 8.
KEGG pathways associated with fruiting body wrinkle Scatter plot of KEGG pathways enriched for unigenes that were up- or down-regulated by the wrinkle morphology. The X-axis displays the Rich Factor which is the ratio of numbers of the unigenes in a pathway term to all gene numbers annotated in the same pathway term. The size of bubble represents the number of unigenes and the color gradient indicates the corrected P value by Benjamini-Hochberg FDR method. Only pathways with corrected P < 0.05 were shown.

