Fig. 1.
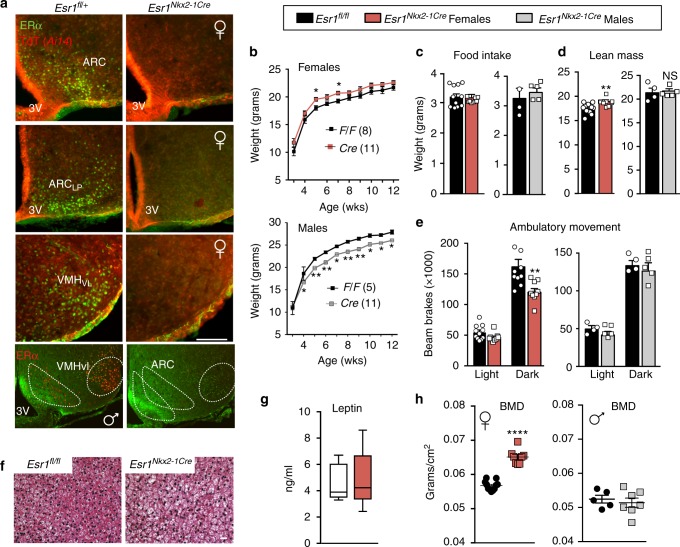
Ablating ERα in MBH impairs energy expenditure and increases bone density. a Immunohistochemistry of ERα (green) or native TdTomato (TdT (Ai14); red) on coronal brain sections (scale bar = 100 µm) of Esr1fl/+; Ai14fl/+; Nkx2-1Cre (control) or Esr1fl/fl; Ai14fl/+; Nkx2-1Cre (mutant) from females or males (bottom panels). Lp lateroposterior. Fl/+ = heterozygous for Esr1 floxed allele. b Body weight curves of control (black line) or mutant females (red line) (F1,250 = 57.01, p < 0.0001) and males (grey line) (F3,316 = 25.39, p < 0.0001) fed on standard chow from 3 weeks of age. c Daily food intake per animal over 24 h determined in CLAMS (controls (black bars) mutant females (red bars) and mutant males (grey bars)). d Lean mass and e averages of ambulatory movement per animal over 12 h determined by metabolic chamber analyses for Esr1fl/fl and Esr1Nkx2-1Cre female and male cohorts, female ambulatory movement (F 1,36 = 10.14, p = 0.003). c–e Animals are 8–9-week old. f Representative images of hematoxylin and eosin (H&E) staining of BAT Esr1fl/fl and Esr1Nkx2-1Cre females housed at 22 °C (8–16 weeks). Scale bar = 100 μm. g Serum leptin levels in 9-week-old control (open bars bar, n = 5) and mutant females (red bar, n = 5) (center line = median; bounds extend minimum to maximum). h BMD measured by DEXA in Esr1fl/fl (black circles) and Esr1Nkx2-1Cre females (red squares, 16–23 weeks) and males (grey squares, 11–18 weeks). Unless otherwise indicated, number per group for female controls (n = 11) and mutants (n = 9) and for male controls (n = 4) and mutants (n = 5). Error bars are SEM. Two-way ANOVA (b, e). Unpaired Student’s t tests (c, d, g, h). For all figures, p values = *p < 0.05; **p < 0.01; ***p < 0.001; ****p < 0.0001. NS = p > 0.05

