Fig. 2.
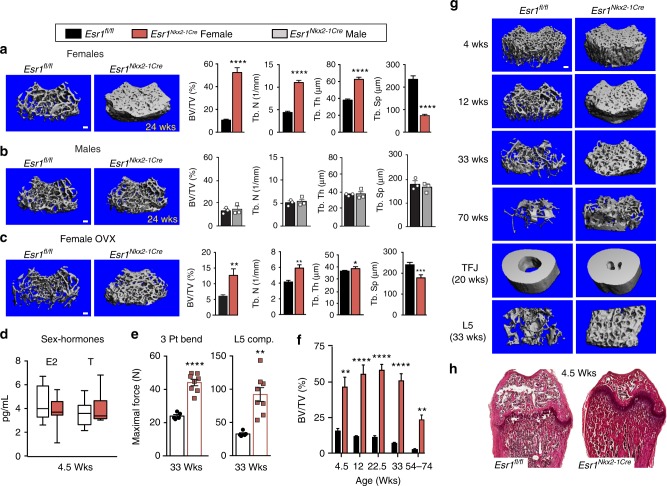
Sex-dependent increase in bone mass and strength in Esr1Nkx2-1Cre females. Representative μCT 3D reconstruction images of distal femurs in ∼24-week-old Esr1fl/fl and Esr1Nkx2-1Cre a females, b males, and c OVX females (15–21 weeks). Right panels show quantitative morphometric properties of distal femurs showing fractional bone volume (BV/TV (%)); trabecular number (Tb. N) trabecular thickness (Tb. Th), and separation (Tb. Sp). For females (n = 11) controls and (n = 8) mutants and for males (n = 3, 3). For OVX (n = 11) controls and (n = 8) mutants. Esr1fl/fl (black boxes), Esr1Nkx2-1Cre females (red bars) and males (grey bars). d LC–MS/MS of plasma E2 and T for Esr1fl/fl (n = 9, open box) and Esr1Nkx2-1Cre (n = 11, red box) juvenile females at 4.5 weeks of age (center line = median; bounds extend minimum to maximum). e Scatter plot of mechanical testing of distal femurs and L5 vertebral bodies (33 weeks) Esr1fl/fl (black squares), Esr1Nkx2-1Cre (red squares). f BV/TV (%) of the distal femur generated by either μCT or 2D histomorphometric analysis over time from 4.5 weeks of age to 54–74 weeks of age, for genotype (F1,50 = 172.1, p < 0.0001), animal number in each Esr1fl/fl and Esr1Nkx2-1Cre group for 4.5 weeks (n = 3, 4), 12 weeks (n = 5, 6), 22.5 weeks (4, 5), 33 weeks (7, 9), and 54+ weeks (9, 7). g Representative μCT images of age-dependent changes in femoral bone mass, as well as image of cortical bone at the tibial fibular joint (TFJ) in females (20 weeks), and L5 vertebral bodies (33 weeks) in Esr1fl/fl and Esr1Nkx2-1Cre females. h Representative H&E staining of female femurs from Esr1fl/fl and Esr1Nkx2-1Cre juvenile females at 4.5 weeks. Error bars are ±SEM (standard error of the mean). Two-way ANOVA (e), Unpaired Student’s t test (a–d, f). *p < 0.05; **p < 0.01; ***p < 0.001; ****p < 0.0001. Scale bars = 100 μm

