Fig. 5.
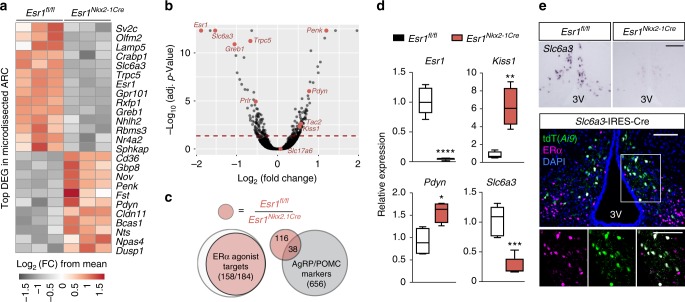
Bone formation correlates with changes in KNDy and DAT ARC neurons. a Heat map of top 25 most significant DEGs in ARC of Esr1fl/fl (n = 3) and Esr1Nkx2.1Cre females (n = 3) (15 weeks). b Volcano plot of data set with highlighted genes (red). Dashed red line represents significance cutoff with adjusted p value < 0.05). c Overlap of DEGs with adjusted p value < 0.05 and |log2 fold change| > 0.6 between ARC from Esr1fl/fl and Esr1Nkx2.1Cre mice (red) with identified ERα agonist-responsive transcripts (white)61,62 and with identified markers of AgRP and POMC neurons (grey)63. d Expression of Esr1, Kiss1, Pdyn, and Slc6a3 measured by qPCR (n = 4–6 per genotype with controls as open boxes and Esr1Nkx2.1Cre females as red boxes; (center line = median; bounds are minimum to maximum). e Representative ISH of Slc6a3 in ARC and confocal image of ARC co-labeled with Slc6a3 reporter (Ai9, tdT), ERα and DAPI. Image scale bars for top and bottom panels = 100 µm. Student’s unpaired t test (d). Error bars are ±SEM. *p < 0.05; **p < 0.01; ***p < 0.001; ****p < 0.0001

