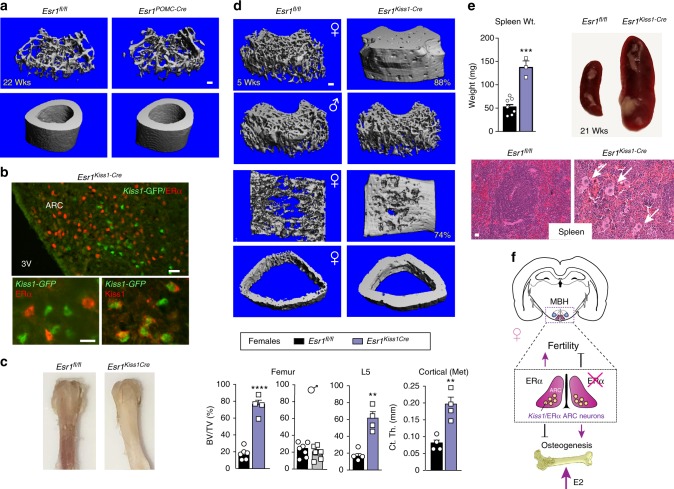
Fig. 6.
Deletion of ERα in Kiss1 neurons elicits an increase in bone mass. a Representative μCT images of femoral and cortical bone for Esr1fl/fl (n = 3) and Esr1PomcCre (n = 3) at 22 weeks of age. b Representative images demonstrating loss of ERα (red) in Cre-GFP-expressing Kiss1 neurons stained for either GFP (green) or KISS1 (red) in the female ARC. Scale bars = 25 µm (top panel) and 10 µm (bottom panels). c Photograph of Esr1fl/fl and Esr1KissCre female femurs at 6 weeks of age. d μCT images of the distal femur, L5 vertebrae and cross section of cortical bone at metaphysis in Esr1fl/fl (black) control and Esr1KissCre mutant females (purple) as well as the distal femur from males (grey, 4.5 weeks). %BV/TV for female distal femur controls (n = 6) and mutants (n = 4), for L5 controls (n = 4) and mutants (n = 4), and the cortical thickness at metaphysis for controls (n = 4) and mutants (n = 4). %BV/TV for male distal femur controls (n = 7) and mutants (n = 6) males. e Spleen weights of younger (4–12 weeks) Esr1fl/fl (n = 7) and Esr1KissCre (n = 3) and images of spleen from a control and a mutant female at 21 weeks of age. Representative images of (20×) H&E stained spleens from control and mutant females at 21 weeks. White arrows point to megakaryocytes. f Schematic showing the positive and negative roles of central estrogen signaling in ARCKiss1 neurons on fertility and bone, respectively. Error bars are ±SEM. Unpaired Student’s t test (d, e). **p < 0.01; ***p < 0.001; ****p < 0.0001. Scale bars = 100 μm

